“The human one is the only species in the world to have polluted the Earth
and it is the only one that can clean it up.”
Dennis Weaver
PREMISE
Air Monitoring Service enabled by an IoT ecosystem to raise awareness among
Lombard population against the alarming problem of air pollution.
SYNOPSIS
The region where I come from is one of the most polluted in Europe. In Lombardy, the polluted air kills thousands of victims every year (Carugno et al., 2016). My research aims to offer a monitoring and an alert service to the Lombard population in order to raise awareness and improve in the long term the situation relating to the problem of excessive PM2.5 and PM10 values in the air (Fig. A), which are the main elements causing cancer and other respiratory diseases related to the health of citizens (Khomenko et al., 2021).
Through the research here conducted, it was intended to design a service equipped by sensors to monitor the harmful substances in the air and providing this tool directly to the user. Indeed, giving him an instrument to analyze the breathed air helps to put him more in contact with this important issue as well as to create a new and denser network of sensors in aid of the public domain.
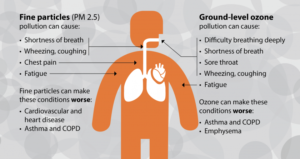
Fig. A
CONTEXT, SCOPE AND
DEFINITION
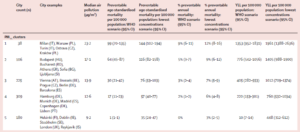
The serious situation inherent to pollution in Lombardy does not depend solely on climatic or environmental factors (Khomenko et al., 2021b). Indeed, this phenomenon derives from an unsustainable approach on the part of the citizen and from a lack of awareness that overlooks this issue. Currently there is only one air monitoring service in Lombardy, offered by ARPA Lombardia, which have no public data and does not allow the monitoring of instantaneous PM data present in the air, which cause thousands of deaths every year (In Italia l’aria inquinata causa il 7% dei decessi. In Lombardia e Campania si muore di più, 2015) (Fig. B & C), and finally does not provide a localization service of sensors placed among the regional territory, leading to a decontextualization of the problem and depriving the citizen of knowing the situation inherent in his neighboring area.
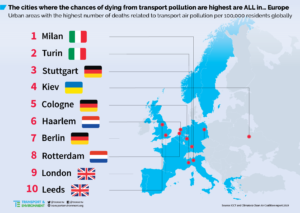
Fig. B
This project aims to develop a service that allows the citizen to know in real time the situation concerning air pollution, alerting the citizen in cases where the particulate thresholds becomes harmful to his health and finally promoting a more sustainable lifestyle for a longer term approach.
I turned to citizens living in Lombardy to carry out this research and for the prototyping of my service.
Main Question
- How can a service enabled by sensors for air monitoring help to raise awareness among Lombard citizens regarding local air pollution?
Sub-Questions
- How can I differentiate and improve my service from what is already existing?
- How can I place the user at the core of this service?
USED METHODS
I used both quantitative and qualitative research methods to formulate new ideas, insights and how to prove them.
Here below is listed a method plan used to conduct my research.
- Survey
- Concept Prototyping
- Focus group
- Alpha Prototyping
- Pitching and feedback
- Beta Prototyping
CREATIVE PROCESS
Survey
Firstly, worried about the situation that afflicts my region, I decide to create a survey on social media channels, to understand if my fellow citizens are aware regarding the local air pollution and if they are in favor of a monitoring and alert service inherent in the air breathed.

This preliminary research, therefore, serves to understand the elevated attention of Lombard citizens regarding air pollution.
Given the votes cast, the following further points are required to develop a Concept Prototype:
- Real-time monitoring service of the particulate values.
- An alert service.
Concept Prototyping
Now, two prototypes need to be developed: one physical prototype and one digital prototype.
The Physical Concept Prototype is created to detect instant values of the PM values present in the air.
To build it, I need:
- Plantower G5 PMS5003 Air Quality Monitoring,
- Arduino UNO Rev 3,
- USB 2.0,
- Jumper wires.
The PMS5003 laser dust sensor is powered by 5V and it has originally an unique wiring that made the connection with Arduino UNO complicated as I have to cut and reconnect the wires based on their connection with the jumper wires.
Below you can see the electrical scheme (Fig. 1), the cables connection (Fig. 2), a screenshot of the signal monitor both in an ordinary (Fig. 3) situation and in the presence of smoke generated by a burning paper (Fig. 4) and the physical model (Fig. 4).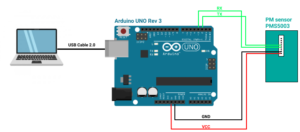
Fig. 1
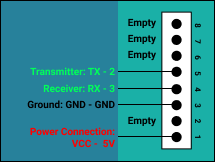
Fig. 2
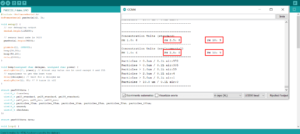
Fig.3
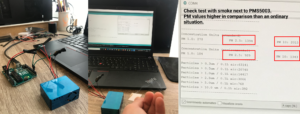
Fig. 4
For the digital concept prototype I decide to use the IFTTT platform. I create a new applet that allows the platform to send a notification to the user smartphone with an alert message (Fig. 8). To do this, I follow the procedure below which describe the steps necessary to create this action (Fig. 5, 6, 7).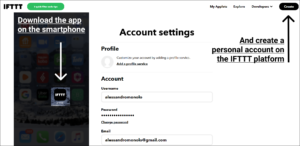
Fig. 5

Fig. 6

Fig. 7
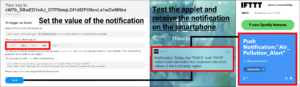
Fig. 8
Now, in order to implement the service and I conduct among possible users a qualitative research to acquire new ideas and insights.
Focus Group
The focus group is carried out on six citizens currently living in Lombardy.
Through the following link, it is possible to view the entire discussion.
Below are the main insights which will base the implementations for the next iteration phases.
- Create a dashboard where citizens can view the past trends data relating to PM values.
Maintain the monitoring and alerting of PM values as the core of the service. - Make my prototype autonomous from an energy point of view and try to include the user more within its service.
The second point requires a forward research, which will be investigated after the second iteration.
Alpha Prototyping
In order to make available a previous overview regarding the trends of the PM2.5 and PM10 captured by the PMS5003 sensor, it is necessary to transform the prototype from static to networked using a WIFI Module. Furthermore, to store the values of the previous PM data, an API key is considered necessary in order to connect the data on a web platform.

For what concern the physical alpha prototype, it is now necessary to replace Arduino UNO with ESP8266 12F which allows to connect the PMS5003 sensor and its detected values online.
Before to use ESP8266, it must first download the NodeMCU 1.0 (ESP-12E Module) board as well as its library ESP8266.Wifi, (Fig. 9).
To power the sensor I now have to connect the sensor to a MB 102 breadboard which supplies 5V as the ESP8266 board allows a maximum voltage of 3.3V (Fig. 10 and Fig. 11).
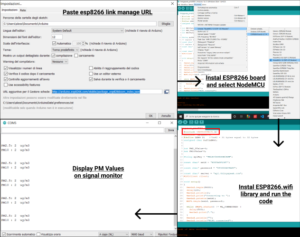
Fig. 9
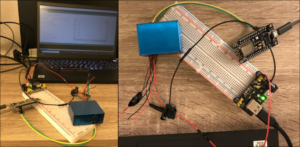
Fig. 10
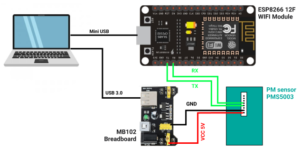
Fig. 11
Now, having created my IoT, I can connect my physical prototype to the digital one and to do that, I use the web platform ThingSpeak.
Here I create a new channel, where I set the two values (PM2.5 and PM10) detected from the sensor.
Now, I can get the API Key (FM1XC5DS4GOM0XSW) which is necessary to connect my prototype with ThingSpeak.
A resume of the steps are shown here below (Fig. 12).
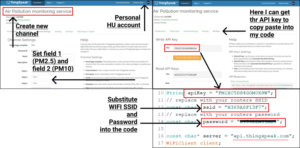
Fig. 12
As indicated within the focus group, the users would monitor the PM trend during previous days/weeks. To do that it is necessary to create an ad-hoc dashboard, (Fig. 13). Furthermore, the users also want to monitor in real-time PM2.5 and PM10, therefore another dashboard is included, (Fig. 13). Finally, an alert lamp is inserted to notify users whenever the PM value exceeds the maximum tolerable thresholds (Fig. 14), accordingly to the limits imposed by the Italian legislation (Fig. 15).
[aesop_image img=”https://cmdstudio.nl/mddd/wp-content/uploads/sites/58/2021/03/alpha-digital-prototyping-1.png” panorama=”off” align=”center” lightbox=”on” captionsrc=”custom” captionposition=”left” revealfx=”off” overlay_revealfx=”off”]
Fig. 13
[aesop_image img=”https://cmdstudio.nl/mddd/wp-content/uploads/sites/58/2021/03/alpha-digital-prototyping-2.png” panorama=”off” imgwidth=”700″ align=”center” lightbox=”on” captionsrc=”custom” captionposition=”left” revealfx=”off” overlay_revealfx=”off”]
Fig. 14
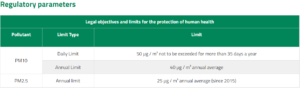
Fig. 15
Now, to implement the prototype another research method is required to place at the core the user within this service as requested by the focus group.
Pitching and Feedback
Here, the main point regards how to provide my prototype to users and let them use it right away, thanks to an implementation that can render it easily spreadable among Lombard citizens, thanks for instance to a independent power supply equipment for the physical prototype.
Beta Prototyping
In order to make the physical prototype a stand-alone IoT, it is necessary to equip it with a power supply module.
I intend to exploit the high amount of sunlight hours present in Italy (Fig. 16).
As with the physical alpha prototype, the physical beta prototype must also be able to guarantee a power supply of 5V, therefore, it is equipped with a compact solar module of the same voltage.
The electrical scheme (Fig. 17) and the physical model after the third iteration (Fig. 18) are presented below.

Fig. 16
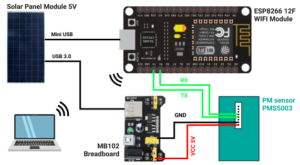
Fig. 17
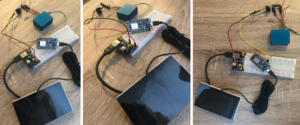
Fig. 18
Finally, in order to resume what could be the user interfaces of the digital service, I created this video.
The goal is to monitor, alert, make available PM value trends, provide useful advice on how to improve the situation through a long-term approach and lead to users a shock comparisons, such as PM2.5 equivalence and passive cigarettes smoked using the Berkeley earth model (Richard et al., 2015) (point 3 and 5 of the focus group).
CONCLUSION
Sensors are a useful method to constantly capture data necessary to monitor values significant for a topic with a social relevance.
Connected between each other they can create a network, becoming viral and placing the citizens at the core of the solution, according to a specific use. Furthermore, networked to a digital service, such as an app, is given tangibility and scalability to the problem, as the pollution issue is no longer seen as something distant and decontextualized but rather closer to the everyday life of citizens and thus, it encourages users to take constant action, without experiencing the problem in a passive way.
FURTHER RESEARCH
Further researches are required in order to bring a second shock comparison for smokers, such a counter of number of days/weeks/months lost because of the air pollution and finally a sensor able to detect NO2 (Copat et al., 2020), another dangerous substance which cause deaths every year.
REFERENCE
Carugno, M., Consonni, D., Randi, G., Catelan, D., Grisotto, L., Bertazzi, P. A., Biggeri, A., & Baccini, M. (2016). Air pollution exposure, cause-specific deaths and hospitalizations in a highly polluted Italian region. Environmental Research, 147, 415–424. https://doi.org/10.1016/j.envres.2016.03.003
In Italia l’aria inquinata causa il 7% dei decessi. In Lombardia e Campania si muore di più. (2015, June 4). Sanità24. https://www.sanita24.ilsole24ore.com/art/dal-governo/2015-06-04/in-italia-l-aria-inquinata-causa-7percento-decessi-lombardia-e-campania-si-muore-piu-115314.php?uuid=ABJv9IsD
Khomenko, S., Cirach, M., Pereira-Barboza, E., Mueller, N., Barrera-Gómez, J., Rojas-Rueda, D., de Hoogh, K., Hoek, G., & Nieuwenhuijsen, M. (2021). Premature mortality due to air pollution in European cities: a health impact assessment. The Lancet Planetary Health, 5(3), e121–e134.
Copat, C., Cristaldi, A., Fiore, M., Grasso, A., Zuccarello, P., Signorelli, S. S., Conti, G. O., & Ferrante, M. (2020). The role of air pollution (PM and NO2) in COVID-19 spread and lethality: A systematic review. Environmental Research, 191, 110129.
Earth, B. (2015, December 17). Air Pollution and Cigarette Equivalence. Berkeley Earth. http://berkeleyearth.org/air-pollution-and-cigarette-equivalence