Premise
A data-driven solution to help consumers experience excellent beers they did not know until that moment.
Synopsis
In the world, before COVID, my friends and I love to taste different craft beers at the bar. One of my friends knows almost everything about the beers on the menu and recommends the rest of the group the best matching beer. However, if he is missing during the occasion, the rest of the group sticks to beers they already know. In that case, we do not know what to order. And also, other people are dealing with this same problem. Most consumers do not know what kind of beer they like. They only know the types light, dark, and lager. The number of craft beer breweries in the Netherlands is rising; new breweries with their taste make the decision process more manageable. It is time to help us and them to experience unique beers of their favorite flavor.
1. Topic
Problem
The number of craft beer breweries has increased in recent years. As a result, the range of beers has increased significantly. However, consumer demand has also increased. Still, brewers are having trouble finding sales. It is challenging to get the brewed beers in the range from restaurants and shops. The smaller breweries experience this problem even more. The demand is increasing, but so is the supply. In addition, these smaller breweries are run by brewers who brew as a hobby or only on a select number of days a week. They are increasingly forced to invest this time in sales than in brewing. This project aims to let the consumer beers he never had before (Hall, 2018; Niewold,2019; Meesterburrie, 2019). There are two reasons why brewers have difficulties finding sales: The outstanding amount of breweries on the market and The consumer does not know their taste and what beers fit with this taste. (Mirande, 2019; Simon, 2021; Voorpijl, 2017)
Most important insights
The problem that consumers do not know what their taste is can be solved with a data-driven solution. This data-driven solution can be coded in Python. Users enter a beer that they like; the solution calculates what beers are most similar to this beer. To make this solution usable for the user, there must be an interface where the user can enter their favorite beer and see the calculation result.
Scope of the research
The problem that there are too many brewers on the market cannot be solved during this research. But the problem that consumers do not know what beer to like is possible to solve. That will be the focus of this research, to teach consumers what beers fit their preference.
2. Design process
To solve the problem, some experiments are executed. These experiments can be subdivided into four phases: retrieving Data, recommend based on taste, recommend based on multiple properties, and an interface for this model.
Small experiments
The small experiments took place in the first few weeks of this course. These experiments contain research to collect the data and prototype with the image recognition software Lobe.
Data collection
For the building of the recommendation system during graduation, a dataset is needed. The initial idea was to use the untapped API to collect beer check-ins by Dutch users. However, this dataset was only accessible for Untapped business users with a restaurant or bar. Therefore, I took a look at different other APIs: Brewery DB and the beerspot API. These APIs are dealing with the problem that the number of Dutch beers is small and that the API only gets a part of the data. The solution is to scrape this Data from beerfamilie.nl; this website sells craft beers. There is a significant number of Dutch beers with extensive information about the beers.
Image recognition
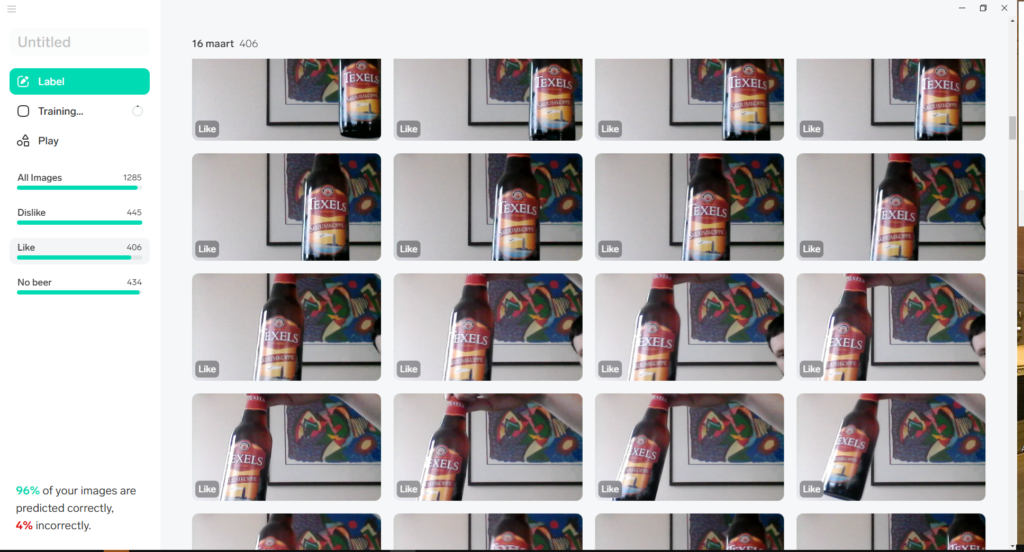
The idea with image recognition is you scan a beer, and it will tell you if this beer is recommended for you with what percentage. The first step is to test with the technique of image recognition. These tests I did with Lobe. I made 1286 pictures of three beers, and I tried to let the program recognize the beer. The result was; 96% of all the images predicted the program well. Several features are important: to take pictures from different perspectives under different light situations. And even more critical different backgrounds. In this way, the model recognizes the similarities between images. The number of images is also essential; the more, the more accurate the model.
The insights from the small experiments are:
- To collect the data of the beers, the best way is to scrape these data from beerfamilie.nl.
- It is possible to recognize beers on their bottle; to use this, it is important to have a recommendation system that calculates the recommendations.
Test with recommendation generation
From the image-recognition test can be concluded a recommendation system is needed. That is why this test is set up. During the process, three tests are executed. This test aims to test or the recommendations are correct and get feedback on how the prototype work. The code for all the prototypes in this category can be found on GitHub.
Dataset
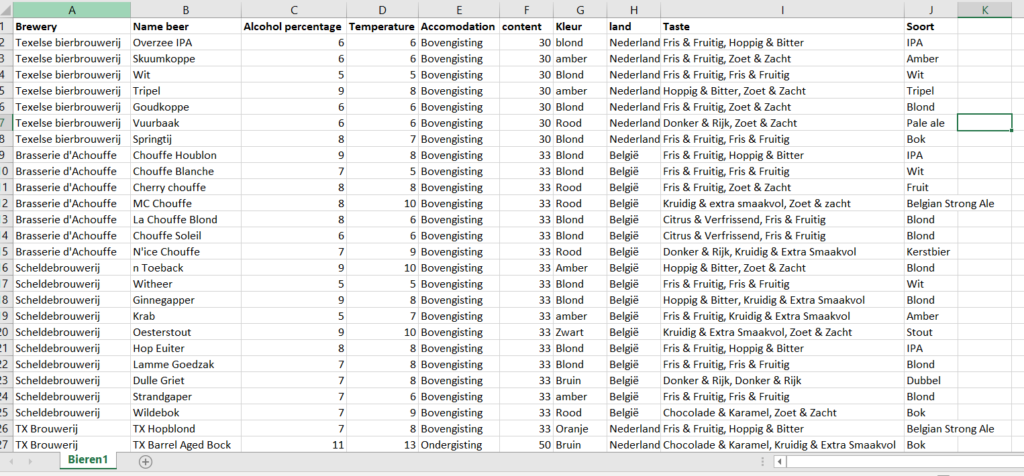
The following prototypes are based on a self-made dummy dataset. In this dataset, there are all beers from four breweries entered. The information for this dataset is from the website beerfamilie.nl. This dataset contains brewery name, name beer, alcohol percentage, optimal drinking temperature, accommodation, country of origin, taste profile, and beer type.
Jupyter notebook recommends beer based on taste.
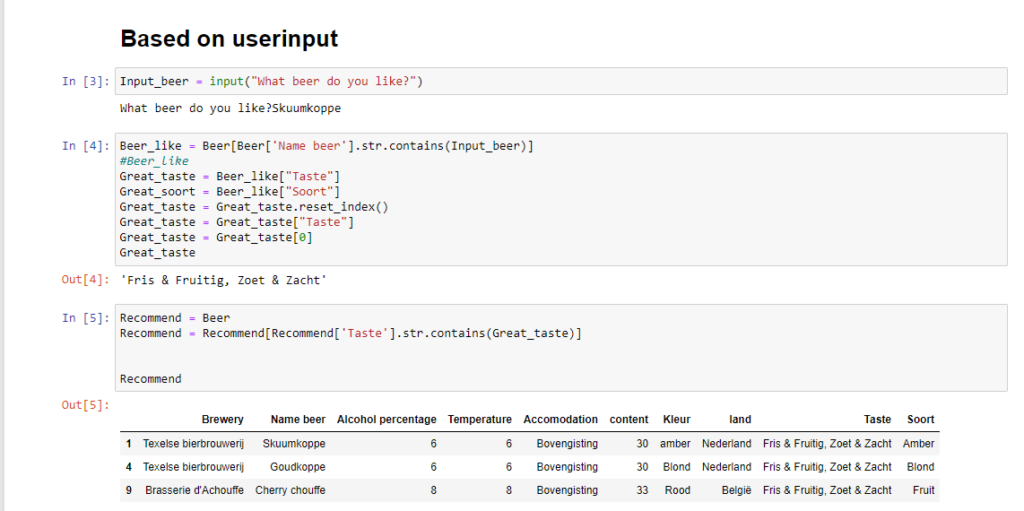
This prototype straightforwardly recommends beers. The users enter a beer from their preference. In the case of this example, it is Skuumkoppe from the Texelse beer brewery. The prototype selects that beer from the dataset. From this beer, the taste feature is extracted. Subsequently, the prototype will search the entire dataset for beers with the same taste.
This first prototype is tested with two persons, and I also critically assessed the prototype. From this, the following insights have been gained:
- The recommendations system is able to advise reasonable equivalent beers (e.g., Brewery, type of beer, or color)
- If there are multiple taste elements, the prototype will only find the exact same combinations.
- Recommendations have to be based on multiple characteristics.
These findings will be the following iteration input: Jupyter notebook that recommends beer based on multiple properties.
Jupyter notebook recommends beer based on multiple properties.
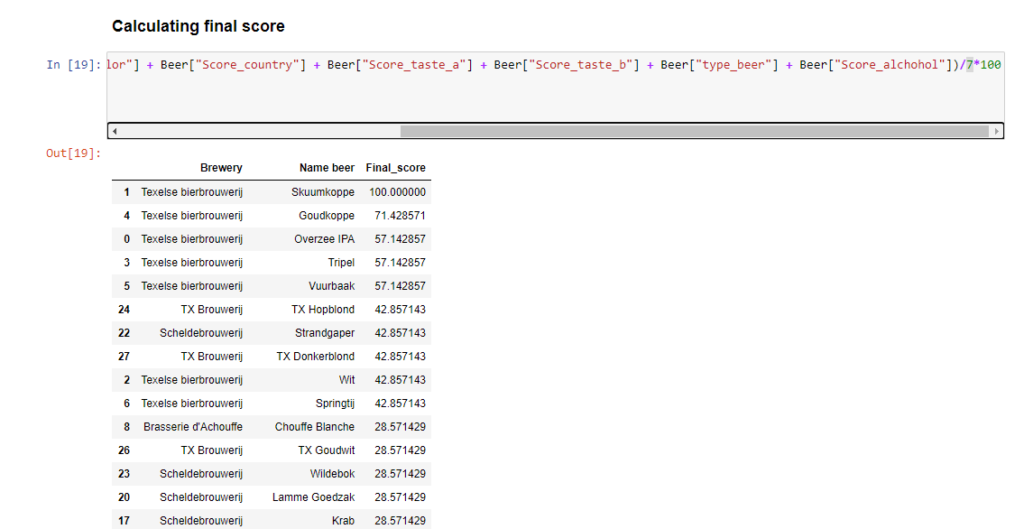
The first prototype was based on only the taste column this iteration on multiple. This prototype works with a points system; if one property is the same as the entered beer, beer will earn one point. The total amount of points is divided by the number of arguments to create a mean. Multiplied by 100 creates a percentage. Beer can have multiple taste profiles; thus, a point is granted if one of the taste profiles has a match. The alcohol percentage is transformed into categories because these percentages are specific. 5,2 would not match with 5. The categories are: Low (equal or less then 5%), Average (5,1 / 7%), High (equal or more then 7,1%).
This second prototype is tested with three persons, and I also critically assessed the prototype. From this, the following insights have been gained:
- Recommendations are better.
- The interface is not user-friendly. There has to be an interface where I can enter my favorite beer and then see the results.
- Not all the characteristics of the beer are equally essential for me.
These findings will be the input for the next iteration: the Dash interface.
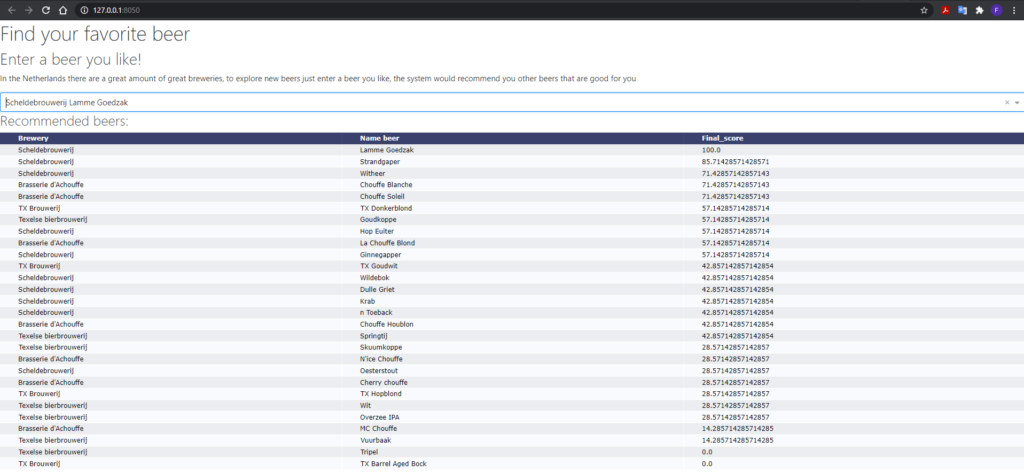
Dash interface
In this third prototype, an interface is developed. In the example, the user enters their favorite beer (A Lamme Goedzak from the Scheldebrewery like the example). The interface is built in Python with Dash for the interactive elements (dropdown menu and table). The calculation is based on the same calculation with a small iteration. The type of beer and taste now weighs two times in the calculation.
This iteration makes the prototype useful for the user. With this simple interface, a user can use the application without any coding experience.
This third prototype is tested with four persons, and I also critically assessed the prototype. From this, the following insights have been gained:
- Great to use this prototype on a website, now I can use it without any coding knowledge.
- Some beers are pretty similar, for example, blonde and white beers. Someone who likes a blond beer most of the time also likes a white beer, and the model can include these similarities.
- Users want the choice to give properties a heavier weight.
- Replace the dropdown menu with a search menu; this is more user-friendly.
- This prototype is working with an elementary form of recommendation generation. To improve this also data from others users can be used = collaborative filtering.
- This prototype is based on one favorite beer now. This can be improved by entering multiple beers.
These findings will be the input for the conclusion of this study.
Conclusion
This prototype is not a complete solution because consumers do not know what beer to drink. But it is a great starting point to let users think about how they would like their recommendations.
In a further development, users need the opportunity to choose the most important aspects for them. In this case, only the properties of the beer are used to recommend. In further iterations, this can be combined with other factors, for example, the context or consumer variables. To reach this, there is also data needed from other users. Then the system will recognize these users in this situation favor these beers. In this way, the user input is more than one beer. And the prototype has to do something with similar beers.
References
Hall, M. (2018, February 5). The Top 5 Challenges for Craft Beer Growth in 2018. Hallway Agency. https://hallway.agency/blog/article/top-5-challenges-for-craft-beer-growth-in-2018/
Meesterburrie, A. (2019, January 15). De groei van speciaalbierbrouwers stagneert: Er is wel erg veel aanbod. Business Insider Nederland. https://www.businessinsider.nl/aantal-brouwerijen-nederland-stagneert/
Mirande, R. (2019, July 17). Bierconsument: ‘Merk minst belangrijke factor bij keuze voor een bier.’ Adformatie. https://www.adformatie.nl/data-insights/merk-minst-belangrijke-factor-bij-keuze-voor-bier
Simon, M. (2021, February 12). De opmars van bier: trends, kennis en in de praktijk. Misset Horeca. https://www.missethoreca.nl/cafe/artikel/2021/01/de-opmars-van-bier-trends-kennis-en-in-de-praktijk-101318090?_ga=2.85235417.1936371356.1615816409-78164876.1615816409
Voorpijl, S. (2017, February 11). België, land der onwetende bierdrinkers. Bierista. http://www.bierista.nl/biernieuws/actueel/belgie-land-der-onwetende-bierdrinkers/
Niewold, M. (2019, January 14). Aantal brouwers stijgt niet meer, ondanks populariteit speciaalbier. RTL Nieuws. https://www.rtlnieuws.nl/economie/bedrijven/artikel/4571186/speciaalbier-razend-populair-maar-piek-brouwerijen-lijkt-bereikt