Premise
Combining topic modeling and sentiment analysis to research tweets and visualize the sentiment expressed around certain topics by political parties and their party leaders in the run op to the Dutch 2021 elections.
Synopsis
People tend to pay more attention to negative or extreme information (Zillmann et al., 2004). When I use social media I experience it myself, I get lost in endless twitter threads of people discussing about a topic I do not even personally care about. The Dutch elections are coming up and by now politicians or their campaign team should be aware of the fact that negative or extreme tweets get attention. During this project I will experiment with different libraries and tools in my attempt to get the right data. Which will enable me to connect topics and sentiment, expressed by politicians, with each other while only using tweets.
Introduction
As journalist, Dutch political elections are always an interesting period. Especially after following the U.S. elections of 2020, where negative campaigning became the standart and distrust and dislike between Democrats and Republicans has never been bigger. The Netherlands is a country of coalitions but this does not mean that polarization is only an American problem. Dutch Research from 2019 shows that people with different political preference are much more negative about each other compared to people with a different religion, level of education, ethnicity, urbanity or region. This aversion is strongest around specific topics like, Europe or migration.
[aesop_quote type=”block” background=”#282828″ text=”#ffffff” width=”100%” height=”50px” align=”center” size=”1″ quote=”“The source of our information and the role of social media may play an even bigger role in these elections compared to 2017 and could lead to more polarization. To what extent do social media strengthen us in our own views and does this increase the aversion to others?”” cite=”Political scientist Eelco Harteveld on UvA.nl” parallax=”off” direction=”left” revealfx=”off”]
The question Harteveld asks himself is complex and I won’t be able to answer it. But it made me curious, what ‘views’ do political parties and their party leaders themselves express on social media and how can state of the art technology help me in my attempt to answer this question.
Project
Views and state of the art technology are too vague. So I defined the main question I am trying to answer during this project: What is the sentiment around certain topics expressed in tweets by political parties and their party leaders in the run up to the Dutch 2021 elections? The technologies used in this project are: Text Mining and Natural Language Processing.
Part 1: Tweets
In the elections 37 parties were listed on the ballot paper (Kok, 2021), but during this project I’m only going to analyse tweets from parties and their leaders who have potential to win a seat in the House of Representatives. On March 2nd, I looked at the poll from Een Vandaag (De Peiling, 2021) to determine twitter accounts.
[aesop_image img=”https://cmdstudio.nl/mddd/wp-content/uploads/sites/58/2021/03/Schermafbeelding-2021-03-03-om-12.32.22-min.png” panorama=”off” credit=”Source: EenVandaag” align=”center” lightbox=”on” captionsrc=”custom” captionposition=”left” revealfx=”off” overlay_revealfx=”off”]
What library works best for this project Tweepy or Twint? Tweepy accesses the official Twitter API while Twint is a scraping tool designed to overcome the limitations of the API (Hwang, 2020). Twint seems to be the best tool for collecting a large number of tweets whereas Tweepy is better for a set including metadata. So Twint looks like the most effective way. To make this conclusion hard, I decided to learn working with both.
I applied for a Twitter Developer account to be able to use Tweepy, but no joke, it is five weeks later and I don’t have access yet. I guess I scared them with the whole political elections subject, because I needed to clarify everything over and over again. So without making my conclusion hard, I just used Twint.
[aesop_image img=”https://cmdstudio.nl/mddd/wp-content/uploads/sites/58/2021/03/Schermafbeelding-2021-03-29-om-11.51.56.png” panorama=”off” align=”center” lightbox=”on” captionsrc=”custom” captionposition=”left” revealfx=”off” overlay_revealfx=”off”]
Part 2: Short Text Topic Modeling
There are a lot of libraries for Topic Modeling, so I started out with filtering out ones with great potential for short text. Researchers Albalawi et al. (2020) created a comparative analysis for using topic modeling methods for short-text data. They concluded Gensims, which contains LDA and LSA, to generate the most valuable outputs.
Latent Semantic Analysis
I started with LSA. Latent Semantic Analysis is a technique for creating a vector representation of a document. Having a vector representation of a document gives you a way to compare documents for their similarity by calculating the distance between the vectors. This in turn means you can do handy things like classifying documents to determine which of a set of known topics they most likely belong to.
[aesop_image img=”https://cmdstudio.nl/mddd/wp-content/uploads/sites/58/2021/03/Schermafbeelding-2021-03-29-om-12.24.05.png” panorama=”off” align=”center” lightbox=”on” captionsrc=”custom” captionposition=”left” revealfx=”off” overlay_revealfx=”off”]
[aesop_image img=”https://cmdstudio.nl/mddd/wp-content/uploads/sites/58/2021/03/Schermafbeelding-2021-03-29-om-12.24.28.png” panorama=”off” align=”center” lightbox=”on” captionsrc=”custom” captionposition=”left” revealfx=”off” overlay_revealfx=”off”]
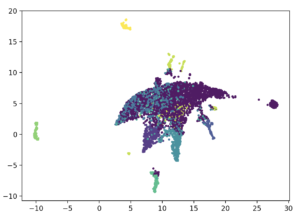
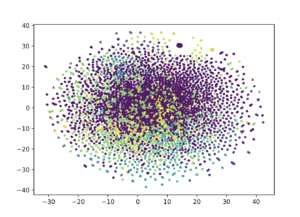
I applied LSA on a dataset of 4000 tweets and a dataset of over 200.000 tweets. To see if the experiment was successful I visualized the clusters using UMAP. Looking at the result for the 4000 tweet dataset we see distinct clusters and overlapping ones, but when we look at the results for the 200.000 tweets dataset al clusters are gone.
I was not satisfied with the result and researched how I could improve results. The options where:
- Translating the tweets to English.
- Adding in more preprocessing steps.
- Using an other model.
Translating
To translate the tweets, I tried three different approaches. Using the Google API, using googletrans and using google_trans_new. But with al of them I ran into the same problem, the Google API has a 5000 character limit. And with a cleaned dataset containing 11842 tweets with multiple characters this was not working.
[aesop_image img=”https://cmdstudio.nl/mddd/wp-content/uploads/sites/58/2021/03/Schermafbeelding-2021-03-29-om-12.53.42.png” panorama=”off” align=”center” lightbox=”on” captionsrc=”custom” captionposition=”left” revealfx=”off” overlay_revealfx=”off”]
[aesop_image img=”https://cmdstudio.nl/mddd/wp-content/uploads/sites/58/2021/03/Schermafbeelding-2021-03-29-om-14.19.57.png” panorama=”off” align=”center” lightbox=”on” captionsrc=”custom” captionposition=”left” revealfx=”off” overlay_revealfx=”off”]
[aesop_image img=”https://cmdstudio.nl/mddd/wp-content/uploads/sites/58/2021/03/Schermafbeelding-2021-03-29-om-12.55.20.png” panorama=”off” align=”center” lightbox=”on” captionsrc=”custom” captionposition=”left” revealfx=”off” overlay_revealfx=”off”]
More preprocessing
I preprocessed the tweets but this time more extensive and neatly. I also added in lemmatization which converts words to their lemma. For example working, worked becomes work. Last but not least, I removed distracting words like ‘maart’.
[aesop_image img=”https://cmdstudio.nl/mddd/wp-content/uploads/sites/58/2021/03/Schermafbeelding-2021-03-29-om-14.19.57.png” panorama=”off” align=”center” lightbox=”on” captionsrc=”custom” captionposition=”left” revealfx=”off” overlay_revealfx=”off”]
[aesop_image img=”https://cmdstudio.nl/mddd/wp-content/uploads/sites/58/2021/03/Schermafbeelding-2021-03-29-om-14.20.26.png” panorama=”off” align=”center” lightbox=”on” captionsrc=”custom” captionposition=”left” revealfx=”off” overlay_revealfx=”off”]
[aesop_image img=”https://cmdstudio.nl/mddd/wp-content/uploads/sites/58/2021/03/Schermafbeelding-2021-03-29-om-14.17.31.png” panorama=”off” align=”center” lightbox=”on” captionsrc=”custom” captionposition=”left” revealfx=”off” overlay_revealfx=”off”]
Gibbs Sampling Dirichlet Multinomial Mixture
LSA assumes that a document can have multiple topics, maybe this is not the right approach in when topic modeling tweets. I found a short text clustering model (Yin & Wang, 2014) GSDMM (Gibbs Sampling Dirichlet Multinomial Mixture) which also displays word topics like LSA but only assumes that a document encompasses one topic.
The GSDMM algorithm uses two conditions to eventually arrive at an optimal configuration: completeness and homogeneity. The GSDMM model has four parameters. I set Alpha α, Beta β, N_iters to their default setting, because in most cases it works fine. I set K, the number of maximum topics to 10, because I am using tweets which are extremely short and I am looking for sub-topics in politics.
[aesop_image img=”https://cmdstudio.nl/mddd/wp-content/uploads/sites/58/2021/03/Schermafbeelding-2021-03-29-om-13.56.23.png” panorama=”off” align=”center” lightbox=”on” captionsrc=”custom” captionposition=”left” revealfx=”off” overlay_revealfx=”off”]
[aesop_image img=”https://cmdstudio.nl/mddd/wp-content/uploads/sites/58/2021/03/Schermafbeelding-2021-03-29-om-13.43.37.png” panorama=”off” align=”center” lightbox=”on” captionsrc=”custom” captionposition=”left” revealfx=”off” overlay_revealfx=”off”]
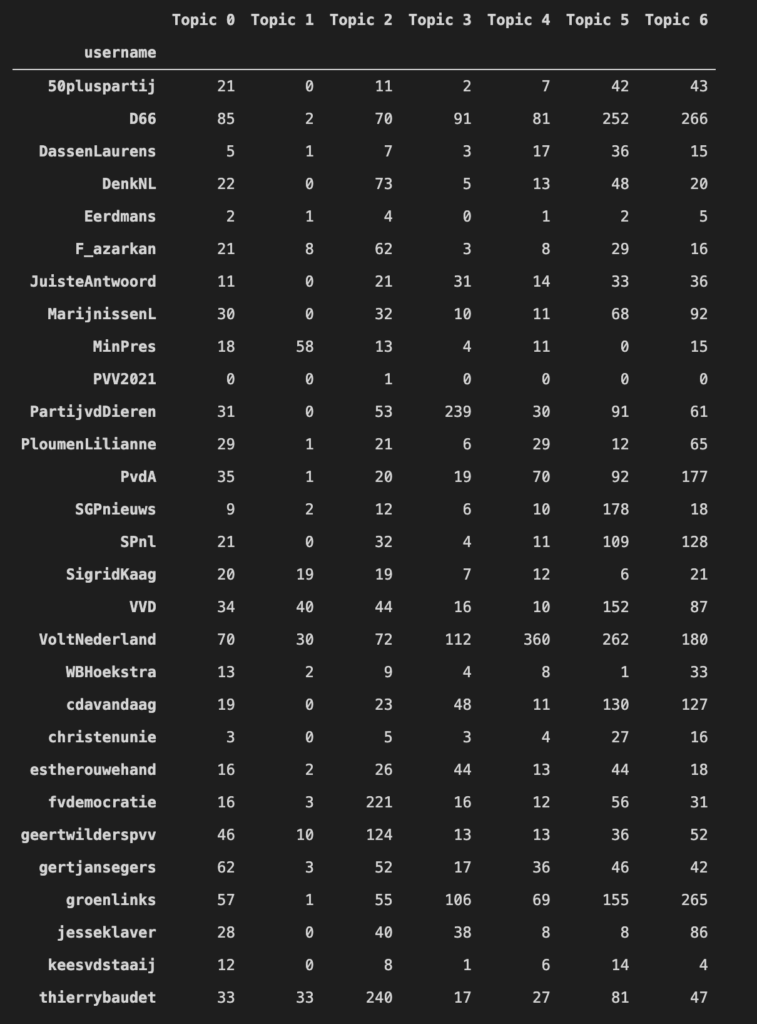
Looking at the created clusters I was able to assign 7 topics to the clusters: onderwijs & kinderen, premier, corona & lockdown, natuur dieren & kernenergie, europa, campagna en woningbouw. I removed the remaining 3 clusters. The visualization of the clusters shows that GSDMM works better than LSA.
[aesop_image img=”https://cmdstudio.nl/mddd/wp-content/uploads/sites/58/2021/03/Schermafbeelding-2021-03-29-om-13.41.24.png” panorama=”off” align=”center” lightbox=”on” captionsrc=”custom” captionposition=”left” revealfx=”off” overlay_revealfx=”off”]
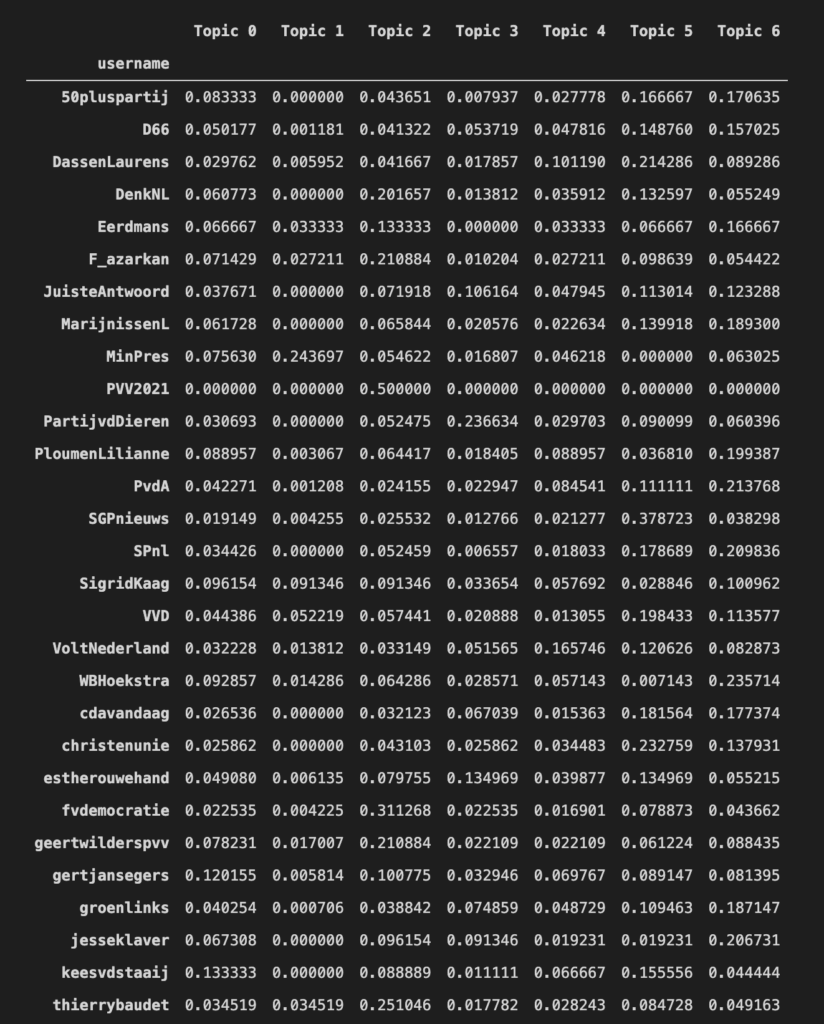
I created a new data frame which allows me to visualize the topic counts for each political party and their party leaders. I converted the values to percentages otherwise I won’t be able to compare.
I created a heat map which gives a better overview of than a table.
[aesop_video src=”youtube” id=”ag9PSp3G1pc” align=”center” disable_for_mobile=”on” loop=”on” controls=”on” mute=”off” autoplay=”off” viewstart=”off” viewend=”off” show_subtitles=”off” revealfx=”off” overlay_revealfx=”off”]
Part 3: Sentiment Analysis
I used the NLP tool VADER that is specifically made for analyzing sentiment expressed on social media. VADER tells how positive or negative a sentiment (Pandey, 2020) is which is essential for this project.
[aesop_image img=”https://cmdstudio.nl/mddd/wp-content/uploads/sites/58/2021/03/Schermafbeelding-2021-03-29-om-14.27.58.png” panorama=”off” align=”center” lightbox=”on” captionsrc=”custom” captionposition=”left” revealfx=”off” overlay_revealfx=”off”]
Insights
Project
Answering the main question: What is the sentiment around certain topics expressed in tweets by political parties and their party leaders in the run up to the Dutch 2021 elections?
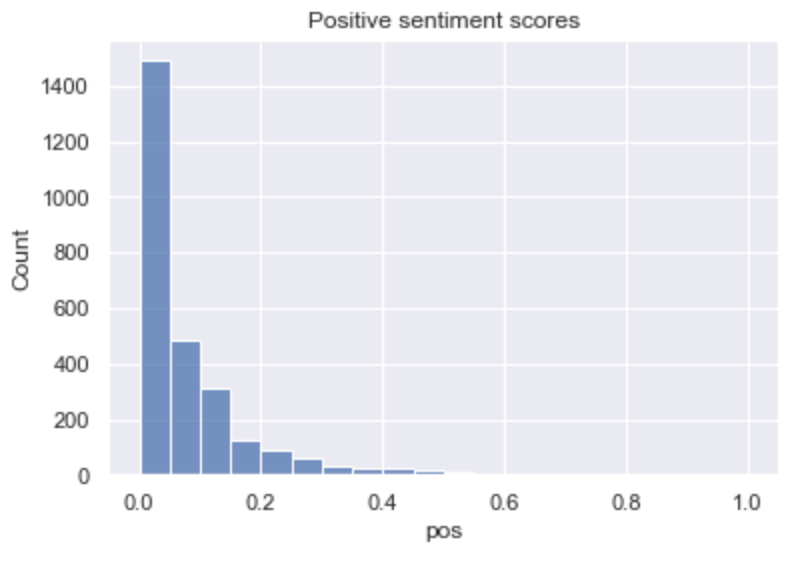
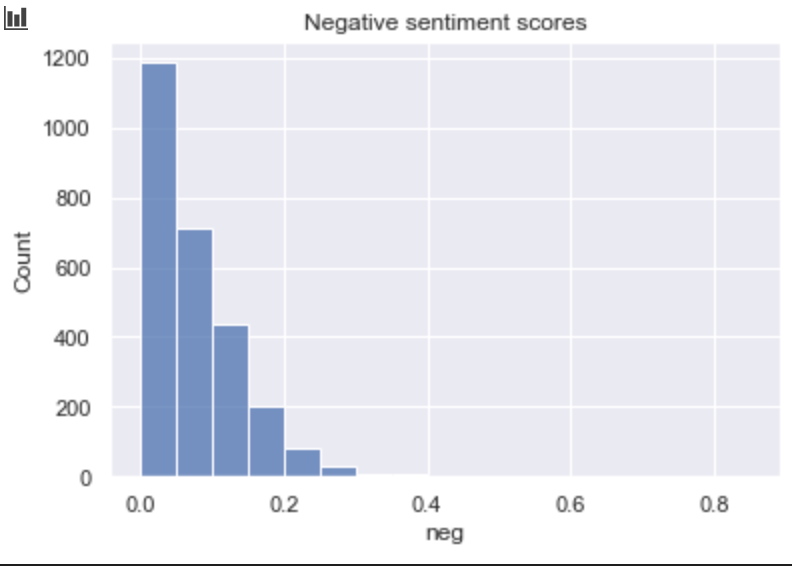
- The tweets with positive and negative sentiment are distributes similarly but the amount of positive tweets is a little bit higher.
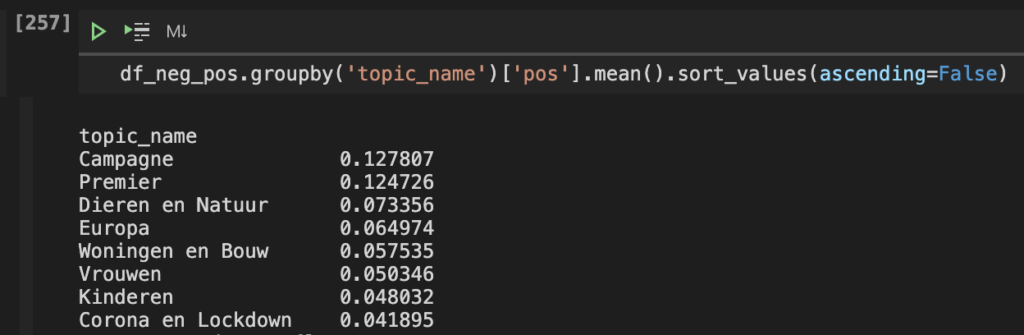
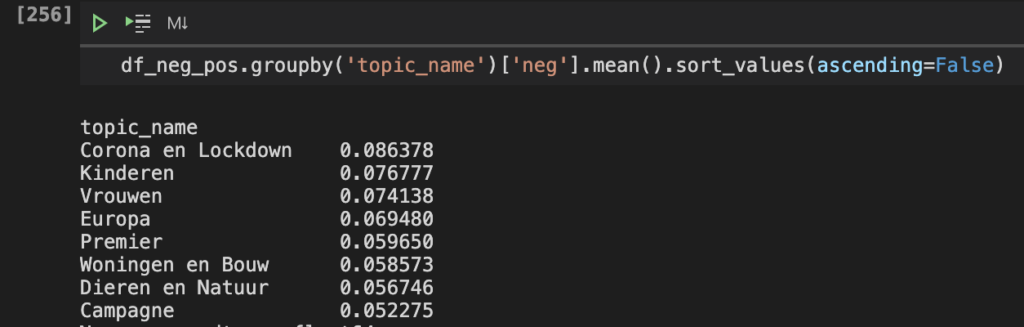
- The topic Corona and Lockdown has most negative sentiment and the topic Campagne the most positive.
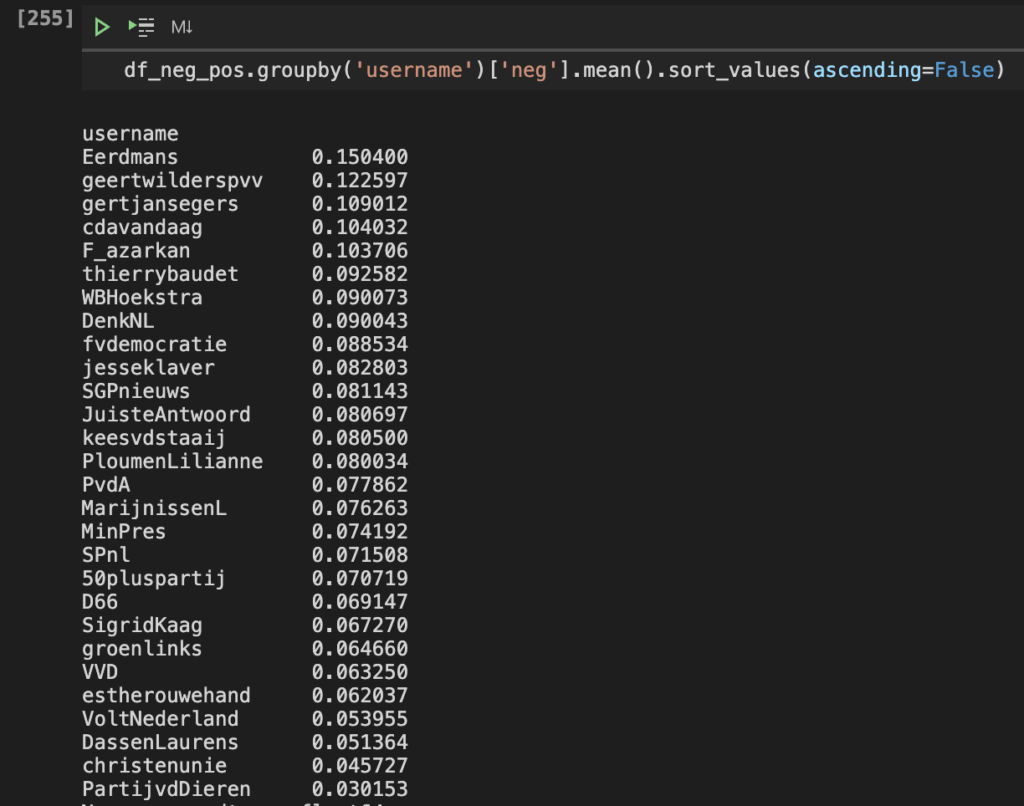
- The politicians Joost Eerdmans, Geert Wilders and Gertjan Segers and political parties CDA, Denk and FvD tweet most with negative sentiment.
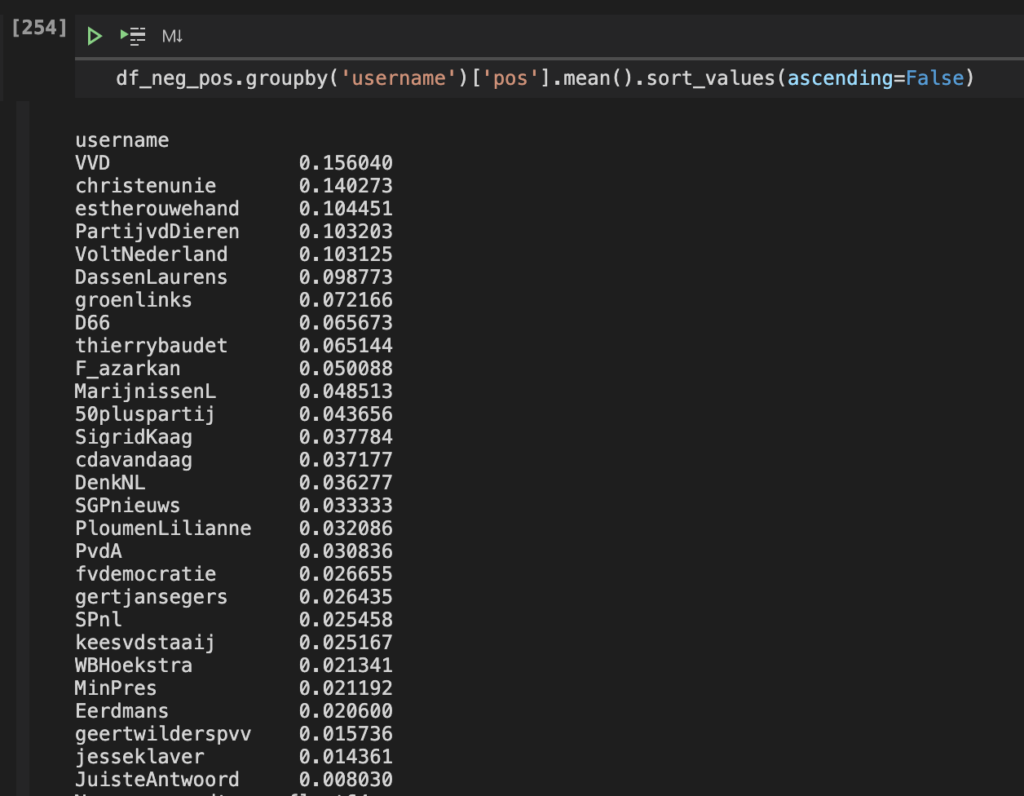
- The politicians Esther Ouwehand, Laurens Dassen and Thierry Baudet and the political parties VVD, CU and PvdD tweet most with positive sentiment.
Technology
- Topic modeling will preform better on longer pieces of text.
- There is a big difference in the amount of tweets posted by the accounts. It is hard to get a good mean of sentiment if an account only retweets.
- Text mining models are quite foolish, they do not link words which belong together like New and York.
- Tweets only have one topic, but words can fit in several clusters.
Conclusion
I learned working with a lot of new technologies. It surprised me with how much ease I was able to apply some like, sentiment analysis and some parts of topic modeling. But this project does not feel finished, because with every step there are so much more opportunities to get better results. For feature research it would be very interesting to look at the interaction with the tweets, so with what sentiment do people comment and how many interaction is there to begin with. Next to additional data it is also interesting to do clustering supervised, instead of unsupervised. What topic are in the party programs and are they matchable with the content of a tweet?
References
Albalawi, R., Yeap, T. H., & Benyoucef, M. (2020). Using Topic Modeling Methods for Short-Text Data: A Comparative Analysis. Frontiers in Artificial Intelligence, 3, 1. https://doi.org/10.3389/frai.2020.00042
De Peiling. (2021, March 2). EenVandaag.nl. https://depeiling.eenvandaag.nl/zetelverdeling/127
Hwang, J. P. (2020, July 18). What Python package is best for getting data from Twitter? Comparing Tweepy and Twint. Medium. https://towardsdatascience.com/what-python-package-is-best-for-getting-data-from-twitter-comparing-tweepy-and-twint-f481005eccc9#:%7E:text=Practically%2C%20if%20the%20only%20thing,those%20using%20the%20official%20API.
Kok, L. (2021, February 5). Nog nooit deden zoveel partijen mee aan de verkiezingen: 37 lijsten op het stembiljet. AD.Nl. https://www.ad.nl/politiek/nog-nooit-deden-zoveel-partijen-mee-aan-de-verkiezingen-37-lijsten-op-het-stembiljet~abff657e/
Pandey, P. (2020, September 11). Simplifying Sentiment Analysis using VADER in Python (on Social Media Text). Medium. https://medium.com/analytics-vidhya/simplifying-social-media-sentiment-analysis-using-vader-in-python-f9e6ec6fc52f
Yin, J., & Wang, J. (2014). A dirichlet multinomial mixture model-based approach for short text clustering. Proceedings of the 20th ACM SIGKDD International Conference on Knowledge Discovery and Data Mining, 1. https://doi.org/10.1145/2623330.2623715
Zillmann, D., Chen, L., Knobloch, S., & Callison, C. (2004). Effects of Lead Framing on Selective Exposure to Internet News Reports. Communication Research, 31(1), 58–81. https://doi.org/10.1177/0093650203260201