Premise
Using Augmented Reality, we studied the environmental impact of animal-based products and how to help young adults reduce their meat ingestion for more sustainable consumption.
🐄 🐄 🐄
Synopsis
As a matter of survival against a Climate Change wave, 2.5 million years ago our bodies evolved to be capable of eating meat, and humans completely adopted it as part of our diet, culture, religion, or environment (Dalton Bassett, 2020). In fact, its demand has triplicated numbers in the last 50 years due to the evolution of production technologies and population growth. This growing demanding market has also a side effect that has been underrated for years and this is, being the first cause of Climate Change, water consumption, land usage, and Greenhouse Gas (GHG) emissions of the century. In the years to come, there is hope for a change but also a high risk of running out of natural resources to feed the whole population due to the lack of actions taken and the lack of social responsibility. In a world where meat plays a big biophysical and biocultural-political role, we will study why it has become a major threat to the environment and how, as designers and citizens through the use of data-driven solutions we can take control and reduce our footprint by reducing its consumption.
Substantiation
If we take a look at our anatomy, our digestive system can only be compared to other primates whose diet is composed of plants, insects, and more rarely meat (Tim Newman, 2017). This means that meat has become a privileged product based on choice and not on need, especially in western cultures (Tim Newman, 2017). In countries such as the USA, meat consumption raises each year reaching 120Kg of meat consumed per person in 2021 (The World Counts,2021) and with expectations of 374Mt of worldwide meat production by 2030 (OECD and Food and Agriculture Organization of the United Nations, 2021).
In order to keep the demand afloat, the production of meat requires 80% out of the 50% of Earth’s land fields just for farming and cultivation of crops leading to the cut-down of 8.2 million hectares in the Amazon for cattle since 2009 (Jessica Brice et al, 2022). Besides, about 4.387Km3 of water is required only in the production of livestock feed (Jens Heinke et al, 2020) meaning that to produce half a kilo of beef, approximately 8.000 liters of water are needed (Foodprint, 2020). Finally, the emission of GHG increased to 10-12% in agriculture being meat production three-quarters of the total (Alex Thornton, 2019) going up to 7.1 gigatons of CO2 emitted per year (FAO, 2017). However, if we moved from a meat diet to a flexitarian diet or vegetarian diet, we would save 920Kg of CO2 per person every year (Peter Scarborough et al, 2014).
If we could all participate in the meat reduction movement by adopting new behaviors, we could reduce 75% of the crop and livestock fields reduce water and land use, decrease GHG emissions, and still feed the whole population (Damian Carrington, 2018).
Inspiration
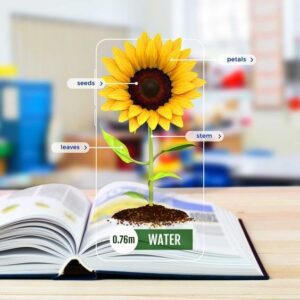
Augmented reality is used in education.

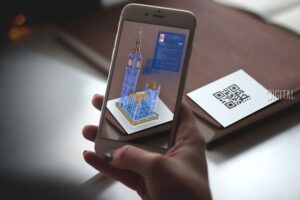
Use of QR Codes.

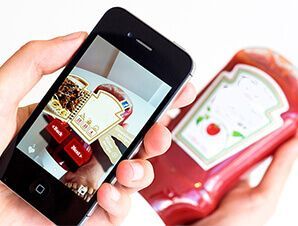
For animated packaging.

Prototypes & Iterations
The research carried out settled the first foundations on what was needed. On one side, it is a topic that is relevant in our societies since we have the power to stop it, but this project is gonna be focused on young adults (18-20 years old) due to the growing vegan/vegetarian and sustainable movements that surround the new generations. On the other side, the lack of new innovative products to help make this issue visible and support people to make the change.
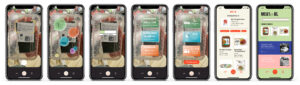
The solution proposed will consist of a mobile application through which the target group will be able to scan the ingredients contained in animal-based products, and with the help of Artivive for Augmented Reality (AR), they will be able to observe the environmental impact implication of the purchase of the scanned product. This shown data would be focused on water consumption, land use, and gases emitted into the environment in order to generate a first impact on the consumer’s eyes and will follow by recommending sustainable alternatives to encourage the reduction of animal-based products or the increase of plant-based products in their shopping list.
Due to the limited project scope and the lack of further insights from user needs, this study will provide a proof-of-concept that will be of great use in further research.
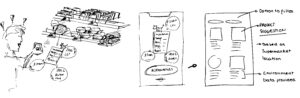
Sketched for the Augmented Reality flow
First Iteration
The first prototype was made during the AR workshop. The main purpose was to learn how to design AR and start with the first visualizations of the idea. The data was collected from the source ‘Our World in Data’ and ‘Faunalitics’, both data platforms that study and collect data regarding our world’s footprint. After this workshop, I got my first insights from colleagues.
The intention behind the prototype was not 100% obvious among potential users because it was not understood how they would be able to obtain this information. Also, there was a clear lack of animation skills and user-friendly design when it comes to the representation of the figures and text. Despite the good feedback regarding the importance of the topic and the need for new solutions to it, they wondered what would they do with this information or how would they proceed afterward.
Second Iteration
The goal of this second iteration was to give proper space to the idea, improve the animation flow in order to obtain a better user experience, give the target audience the possibility of recommendations for a reduction of the animal-based product scanned, and finally, to have a first interactive prototype to be tested. I continued making use of Artivive together with Photoshop and Illustrator to create the animation, and Figma to develop the Interactive Prototype. The technology seemed to be working well, however, I encountered the first limitations of Artivive such as a lack of design resources within the platform.
Nevertheless, second testing was carried out with two potential users who made use of the interactive prototype. Once again, the concept and idea brought up a longer conversation about this already mentioned issue, and they both showed their curiosity to learn more about what is going on and they were willing to make a change if they had the resources. On the other hand, they mentioned their ignorance of what the number of liters or land really meant for the daily consumer. Besides, they felt the recommendations were a bit arbitrary instead of providing a clear ‘Why?‘ are they better than the product scanned.
Third Iteration
For this third iteration, I prioritized the understanding of the figures and data provided to the user. This is, to create a comparative example in order to land the information so it is easy to identify by the consumer, and therefore, better frame the issue. The main obstacle found here is the difficulty to translate certain figures into common-known measurements (i.e. land usage square meters into the size of a king bed). Continuing with the improvements, now the recommended alternatives count with a description of what they would mean to the environment. Once the user clicks on one of the products, they will see an explanation of the analysis of that product. This could be obtained thanks to an API (there is one for Albert Heijn and for Jumbo) that would collect the ingredients of the selected products plus, the use of previous data to calculate each product’s impact.
Finally, the prototype was again tested by 5 potential users. They could point out the differences from the previous iteration but there still seems to be room for improvement in order to involve all audiences. Some measurements are not representative of all countries (i.e. King size bed), wording such as ‘This product means‘ could be rephrased to avoid repetition, and the animation could still be polished for better reading. Despite that, once again they showed interest in the topic and suggested the implementation of articles or recipes in order to learn more.
Extra Iteration
As mentioned before, Artivive was quite limited in terms of animation resources and possibilities. That is why I looked for other tools such as Scandit or BlippBuilder to experiment a bit further. The tools required more time investment but in this case, BlippBuilder made it easier to come up with the desired prototype.
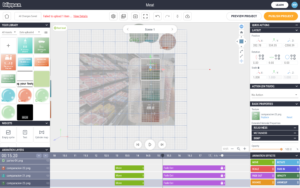
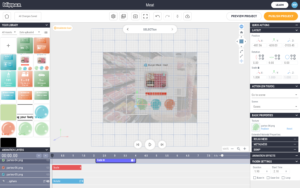
BlippBuilder experimentation
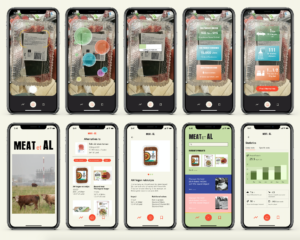
Final Prototype
I took pictures of animal-based product ingredients to generate a composition that would support the animation later on. The animation was polished for better reading and the interactive prototype was improved for a better flow of the app. Future iterations would include, a better platform to generate AR, more information regarding what the app is and does, and a feature that would track the user’s environmental footprint for a more interactive feeling of growth.
Conclusion
We are facing one of the biggest environmental issues of the century and it is about time that we run out of food for the whole population, out of rainforest that cleans our air, and out of freshwater that calms our thirst. According to users, initiatives such as ‘MEAT et AL’ could make an impact on our eating behaviors with the main goal to reduce animal-based products and lean toward a plant-based diet. The app does its function, however, the technology chosen may not have been the most appropriate.
Reflection
The proof concept objective has been achieved through the use of AR for this study. The data presented was of great impact on users and set the firsts conversations regarding the issue proving that there is common basic knowledge among the target audience chosen, but a lack of resources to transition to a greener consumption. As mentioned before, the technology chosen has proven to not be the best fit for the purposes of this study due to the restrictive applications and the discomfort of its use when shopping. I’ve learned the principles of AR but for future iterations regarding the graduation project (GP), I will focus on the recommendation part of this prototype together with the idea of helping users reduce their animal-based product consumption when doing their groceries. Hopefully, this will be more appealing to the target group to download the app and develop new sustainable consumption choices.
References
Bassett, D. (2020, July 7). A look at meat throughout western history. Faunalytics. Retrieved March 23, 2022, from https://faunalytics.org/a-look-at-meat-throughout-western-history/
Newman, T. (2017, November 15). Are we supposed to be vegetarian? Medical News Today. Retrieved March 25, 2022, from https://www.medicalnewstoday.com/articles/320047
Globally, we consume around 350 million tons of meat a year. The world counts. (n.d.). Retrieved March 7, 2022, from https://www.theworldcounts.com/challenges/consumption/foods-and-beverages/world-consu mption-of-meat/story
Home. OECD-FAO Agricultural Outlook 2021-2030. (2021). Retrieved April 2, 2022, from https://www.oecd-ilibrary.org/sites/19428846-en/1/3/6/index.html?itemId=%2Fcontent%2Fpublication%2F19428846-en&_csp_=78a77099f3b0c6eae1de8bfe93d3b09e&itemIGO=oecd&itemContentType=book#section-d1e21065
Brice, J. (2022, January 21). How Big Beef Is Fueling the Amazon’s Destruction. Bloomberg.com. Retrieved March 27, 2022, from https://www.bloomberg.com/graphics/2022-beef-industry-fueling-amazon-rainforest-destructi on-deforestation/
Heinke, J., Lannerstad, M., Gerten, D., Havlík, P., Herrero, M., et al. (2020, November 20). Water Use in Global Livestock Production—Opportunities and Constraints for Increasing Water Productivity. https://agupubs.onlinelibrary.wiley.com/doi/10.1029/2019WR026995. Retrieved March 27, 2022, from https://agupubs.onlinelibrary.wiley.com/doi/10.1029/2019WR026995
The water footprint of food. FoodPrint. (2020, August 11). Retrieved March 27, 2022, from https://foodprint.org/issues/the-water-footprint-of-food/#:~:text=Pound%20for%20pound%2 C%20meat%20has,gallons%20of%20water%20to%20produce.
Thornton, A. (2019, February 8). This is how many animals we eat each year. World Economic Forum. Retrieved March 27, 2022, from https://www.weforum.org/agenda/2019/02/chart-of-the-day-this-is-how-many-animals-we-eat -each-year/
Key facts and findings. FAO. (n.d.). Retrieved March 6, 2022, from https://www.fao.org/news/story/en/item/197623/icode/
Scarborough, P., Appleby, P. N., Mizdrak, A., Briggs, A. D. M., Travis, R. C., Bradbury, K. E., & Key, T. J. (2014, June 11). Dietary greenhouse gas emissions of meat-eaters, fish-eaters, vegetarians and vegans in the UK – climatic change. SpringerLink. Retrieved March 27, 2022, from https://link.springer.com/article/10.1007/s10584-014-1169-1
Khanna, R. (2021, March 5). Industrial Meat Production and Climate Change: Solutions for Sustainability. Crossfire KM. Retrieved March 27, 2022, from https://www.crossfirekm.org/articles/industrial-meat-production-and-climate-change-solution s-for-sustainability
Carrington, D. (2018, May 31). Avoiding meat and dairy is ‘single biggest way’ to reduce your impact on Earth. The Guardian. Retrieved March 27, 2022, from https://www.theguardian.com/environment/2018/may/31/avoiding-meat-and-dairy-is-single-b iggest-way-to-reduce-your-impact-on-earth
Fleming, S. (2019, February 1). This is how much water is in your Burger. World Economic Forum. Retrieved April 3, 2022, from https://www.weforum.org/agenda/2019/02/this-is-how-much-water-is-in-your-burger/
Ebikeme, C. (2013, July 25). Water world. Nature news. Retrieved April 3, 2022, from https://www.nature.com/scitable/blog/eyes-on-environment/water_world/
Wilson, M. (2020, June 30). How much land does it take to produce one pound of beef? Restaurantnorman.com. Retrieved April 3, 2022, from https://www.restaurantnorman.com/how-much-land-does-it-take-to-produce-one-pound-of-beef/
De Groote, M. (2012, July 12). ‘water footprints’ and how much water is in your hamburger. Deseret News. Retrieved April 3, 2022, from https://www.deseret.com/2012/7/12/20504393/water-footprints-and-how-much-water-is-in-your-hamburger#:~:text=In%20addition%20to%20meat%2C%20burger,that%20cows%20are%20raised%20in.
Ritchie, H. (2020, March 10). The carbon footprint of foods: Are differences explained by the impacts of methane? Our World in Data. Retrieved April 3, 2022, from https://ourworldindata.org/carbon-footprint-food-methane
Tiseo, I. (2021, September 14). Food product GHG emissions per kilogram worldwide. Statista. Retrieved April 3, 2022, from https://www.statista.com/statistics/1201677/greenhouse-gas-emissions-of-major-food-products/
How much water you use. GWMWater. (2018, February 11). Retrieved April 3, 2022, from https://www.gwmwater.org.au/conserving-water/saving-water/how-much-water-you-use
Atkins, M. (2018, February 13). How much CO2 does a car emit per year? Lightfoot. Retrieved April 3, 2022, from https://www.lightfoot.co.uk/news/2017/10/04/how-much-co2-does-a-car-emit-per-year/#:~:text=The%20average%20new%20car%20emits%20120.1g%2Fkm%20of%20CO