Premise
Augmented reality (AR) has the potential to change attitudes towards biodiversity at an individual level.
Synopsis
This project diary discusses the process of creating prototypes using AR to inspire Dutch citizens to act in favor of biodiversity in their garden. An AR and non-AR prototype were built through three iterations and two testing sessions. The prototype suggests plants that are good for biodiversity based on the needs of the user and his garden. AR allows the user to see the plant in his garden. Thus, an innovative AR prototype was built that provides essential information to change attitudes towards biodiversity in private gardens.

Plant suggested to the user displayed in his garden thanks to AR
Problem statement
Biodiversity plays a role in the ecosystems they provide by providing services such as pollination (TEEB, 2011). Since the last century, the Netherlands has lost 85% of its biodiversity (Van Nederlands planten- en dierenrijk is 85 procent verdwenen, 2021). Climate change is a direct consequence of this (Europees Parlement, 2021). A cause of biodiversity loss is urbanization (The Nature Conservancy, 2018). More and more areas are tiled and there are fewer habitats for species. However, there is an existing potential within Dutch private gardens, as 40% of them are tiled (Teije, 2019). Dutch citizens are aware of the biodiversity problem and are willing to get involved (Bredenoord et al., 2020). Private garden owners are in general older than 40 years (Centraal Bureau voor de Statistiek, 2017). What prevents them from acting is the lack of knowledge about what they can do and the desire to have a functional garden that does not require much maintenance (Beumer, 2018). There is a need for a solution that can simultaneously inform Dutch citizens, suits their wishes, and change their attitudes.
One way to change people’s attitudes is to use AR. AR has an ability to change people’s attitudes in favor of environmental issues (Pimentel, 2022) which is important for a balanced society. There is also a link between AR and achievement (Radu & Schneider, 2019) on individual scale. AR could impact the way the average citizen, and therefore also communities, interact with biodiversity. In addition, AR solutions perform better than non-AR solutions (Stumpp et al., 2019). However, in our case, we do not know how AR should be implemented to be more effective than non-AR. Therefore, we will look at how AR can be used to change the attitude of Dutch people over 40 who own a private garden in favor of biodiversity.
Methodology
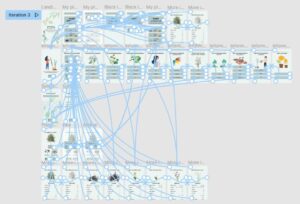
To answer the problem statement, an AR and a non-AR prototype were built respectively using the non-coding website Metaverse and Figma. By creating two prototypes, it is possible to do AB testing by comparing AR implementations with their equivalents. Three iterations were built to improve the prototypes. Testing sessions were held with testers matching the target group to improve the iterations.

AR prototype in Metaverse environment
Non-AR prototype in Figma environment
Technology
Both prototypes allow the user to choose plants that best suit him and his garden. With the AR prototype, the user can show the plants in his garden. In addition, the user can see information about the plant, such as how valuable the plant is for biodiversity and how much maintenance it requires.
Collecting information
Each garden has different needs, as does each person. Therefore, information collection is important. This is a central component within both prototypes. A questionnaire is used to ask directly about the user’s needs. The criteria for choosing a plant were taken from the study of Kendal et al. (2012) which listed them. The needs of the garden are collected based on location. These include:
- Sun exposure and shade percentage collected through shading simulations (Margolis et al., 2017).
- Soil moisture collected using satellite data (VanderSat, 2021).
- Soil type collected using soil type data (Assinck, 2006).
- Garden size collected once the user draws his garden on a map.
To avoid incorrect collection of information, there is a possibility to modify this data manually. In addition, the collection of data can be done to the nearest centimeter as well as the geolocation of the user. This makes it possible to advise the user to the centimeter where he can plant a plant in his garden (Xiaohong & Xingxing, 2011).
Biodiversity and maintenance score
To help the user in his choice, a biodiversity and maintenance score is displayed for each suggestion. The suggested plants are based on a report written by Hoffman (2010) that lists plants beneficial to biodiversity. In this report, each plant is assigned a category of animal species for which it is beneficial. The biodiversity score is based on these categories. To simplify communication, the score is divided into three categories: low (beneficial for one category of animal species), medium (beneficial for two to three) and high (beneficial for more than four). The maintenance score also includes low, medium, and high categories. However, no studies have been found to determine each category precisely. Therefore, it was decided to let the testers determine what each category represents.
Prototypes
Iteration 1
- AR prototype link: https://mtvrs.io/ImprobableMediumpurpleNoctilio
- Non-AR prototype link: https://www.figma.com/proto/EsZQeYs8eoHELzyAagPYly/Non-AR?node-id=7%3A2&scaling=scale-down&page-id=0%3A1
The first iteration consisted of gathering information about the user and their garden and a plant suggestion with a biodiversity and maintenance score. These functionalities were outlined in low-fidelity wireframes. The AR and non-AR prototype mostly overlapped. The plant suggestion in the AR prototype was rendered in AR. This allowed the user to view the plant in their garden, move it around, and pin and resize it at a certain point.
To test the first iteration, testing sessions were organized. These sessions took place in the garden of each tester. First the non-AR prototype was tested and then the AR prototype. The testers were informed that the testing session was not about the accuracy of the proposed plant since it was the same regardless of their answers to the questionnaire. The goal was to find out if the functionalities of the application were sufficient (role) and to know the potential of the AR version (look and feel). The testers were asked to use the prototypes with the scenario that they wanted to plant a new plant in their garden. After testing, an interview took place using several questions (Appendix I). The results of the interviews were used as input for iteration 2. A summary of this can be found in Appendix II.
AR prototype iteration 1
Iteration 2
- AR prototype link: https://mtvrs.io/SpringgreenPowerfulWeaverbird
- Non-AR prototype link: https://www.figma.com/proto/EsZQeYs8eoHELzyAagPYly/Non-AR?node-id=36%3A126&scaling=scale-down&page-id=2%3A2&starting-point-node-id=36%3A126&show-proto-sidebar=1
The second iteration was built based on the collected feedback. Clickable medium-fidelity prototypes were created, making the application attractive to use. The prototypes consisted of a more extensive questionnaire and more information was shared about the suggested plants (e.g., height of the plant, appearance of the plant in winter). The AR and non-AR prototypes consisted of almost the same functionalities. The AR prototype offered a new feature to display multiple specimens of the same plant type.
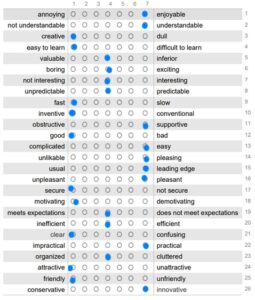
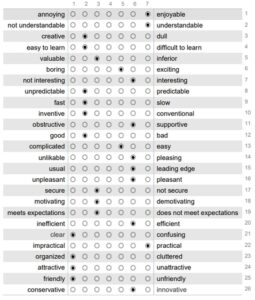
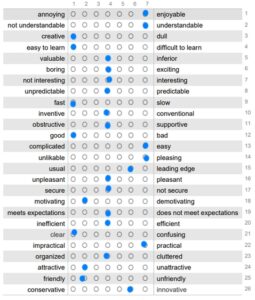
The second round of testing sessions proceeded like the first round. The same testers were involved. The focus of the session was on the content of the application (look and feel) and whether the users’ needs were met (role). Thanks to the clickable medium-fidelity wireframes, the prototypes gave a better insight for a comparison between the AR and non-AR prototype. For this reason, a user experience questionnaire (UEQ) was completed in addition to an interview. The questions from the interviews are in Appendix III and the completed UEQ in Appendix IV. The answers showed that the AR prototype is perceived as more innovative, motivating, and attractive. A summary of the outcomes of the interviews and the changes needed for the third iteration can be found in Appendix V.
AR prototype iteration 2
Iteration 3
- AR prototype link: https://mtvrs.io/JoyousUnhealthyAndalusianhorse
- Non-AR prototype link: https://www.figma.com/proto/EsZQeYs8eoHELzyAagPYly/Non-AR?node-id=102%3A23320&scaling=min-zoom&page-id=2%3A3&starting-point-node-id=102%3A23320&show-proto-sidebar=1
The third iteration is clickable and almost high-fidelity. Most of the testers’ wishes have been implemented in the form of new features. The biggest addition is a feature that allows the user to have an overview of all their plants with associated information. In the AR prototype each plant can be viewed in the garden. The user can like a suggested plant. This will affect new suggestions. New suggestions will be plants that fit well with the liked plants. A similar process happens when disliking a plant. In addition, it is also possible to search for a plant to get extended information. In the AR prototype, the searched plant is also shown in the user’s environment. Furthermore, the AR prototype also offers the possibility to view all liked plants in the garden at once. The final change offered by the AR prototype is a notification that indicates whether the location where the plant is pinned in the garden suits the plant’s needs (e.g., sufficient space, sufficient sunlight). However, some points were not included in the third iteration due to the limited features of the website used to create the AR prototype. Some points were intentionally not implemented to avoid an overload of information.
AR prototype iteration 3
Conclusion and further research
This research has resulted in successful prototypes. Both the AR and the non-AR prototype met the testers’ needs. The testing sessions show that the AR prototype (based on role and look and feel) has more potential to positively influence attitude than the non-AR prototype. This is possible thanks to the different insights offered by the technology combined with the user’s environment. For follow-up research, it would be interesting to measure the attitude change. The current prototypes offer a fictitious suggestion. A functional AR prototype that provides correct plant suggestions should be created. This prototype can also be more immersive by using 3D elements that are of true size. It can then be tested with the target audience to measure whether there is an attitude change.
References
Assinck, F. (2006). Grondsoortenkaart. WUR. Retrieved April 3, 2022, from https://www.wur.nl/nl/show/Grondsoortenkaart.htm
Beumer, C. (2018). Show me your garden and I will tell you how sustainable you are: Dutch citizens’ perspectives on conserving biodiversity and promoting a sustainable urban living environment through domestic gardening. Urban Forestry & Urban Greening. http://jcsites.juniata.edu/students/PEROWAX16/Urban%20Gardens.pdf
Bredenoord, H., van Broekhoven, S., van Doren, D., Goossen, M., van Oorschot, M., & Vugteveen, P. (2020, January). Maatschappelijke betrokkenheid bij natuur in beleid en praktijk. https://www.pbl.nl/sites/default/files/downloads/20200115_maatschappelijke_betrokkenheid_totaal.pdf
Centraal Bureau voor de Statistiek. (2017, March 9). Huizenkopers worden steeds ouder. Retrieved March 23, 2022, from https://www.cbs.nl/nl-nl/nieuws/2017/10/huizenkopers-worden-steeds-ouder
Europees Parlement. (2021, June 9). Verlies aan biodiversiteit: waarom is dit een probleem en wat zijn de oorzaken? | Nieuws | Europees Parlement. Retrieved March 1, 2022, from https://www.europarl.europa.eu/news/nl/headlines/society/20200109STO69929/verlies-aan-biodiversiteit-waarom-is-dit-een-probleem-en-wat-zijn-de-oorzaken
Hoffman, M. (2010, October). Biodiversiteit in tuin en plantsoen. All-Round Communications. https://library.wur.nl/WebQuery/wurpubs/fulltext/154296
Kendal, D., Williams, K. J., & Williams, N. S. (2012). Plant traits link people’s plant preferences to the composition of their gardens. Landscape and Urban Planning, 105(1–2), 34–42. https://doi.org/10.1016/j.landurbplan.2011.11.023
Margolis, R., Gagnon, P., Melius, J., Phillips, C., & Elmore, R. (2017). Using GIS-based methods and lidar data to estimate rooftop solar technical potential in US cities. Environmental Research Letters, 12(7), 074013. https://doi.org/10.1088/1748-9326/aa7225
Pimentel, D. (2022). Saving species in a snap: On the feasibility and efficacy of augmented reality-based wildlife interactions for conservation. Journal for Nature Conservation, 66. https://doi.org/10.1016/j.jnc.2022.126151
Radu, I., & Schneider, B. (2019). What Can We Learn from Augmented Reality (AR)? Proceedings of the 2019 CHI Conference on Human Factors in Computing Systems. https://doi.org/10.1145/3290605.3300774
TEEB. (2011). The Economics of Ecosystems & Biodiversity. http://www.teebweb.org/wp-content/uploads/Study%20and%20Reports/Additional%20Reports/Manual%20for%20Cities/TEEB%20Manual%20for%20Cities_English.pdf
Teije, S. (2019, October 11). Ruim een derde van de tuinen bestaat uit tegels: ‘Risico op wateroverlast.’ AD.nl. Retrieved March 5, 2022, from https://www.ad.nl/wonen/ruim-een-derde-van-de-tuinen-bestaat-uit-tegels-risico-op-wateroverlast~a047fa76/
The Nature Conservancy. (2018). Nature in the Urban Century. https://www.nature.org/content/dam/tnc/nature/en/documents/TNC_NatureintheUrbanCentury_FullReport.pdf
Stumpp, S., Knopf, T., & Michelis, D. (2019). User Experience Design with Augmented Reality (AR). ECIE 2019 14th European Conference on Innovation and Entrepreneurship. https://www.researchgate.net/profile/Stefan-Stumpp-2/publication/337160678_User_Experience_Design_With_Augmented_Reality_AR/links/5de7d784a6fdcc283706505d/User-Experience-Design-With-Augmented-Reality-AR.pdf
VanderSat. (2021, June 8). VanderSat – Daily, high-resolution observations of Soil moisture. Retrieved April 3, 2022, from https://vandersat.com/data/soil-moisture/
Van Nederlands planten- en dierenrijk is 85 procent verdwenen. (2021, January 19). RTV Oost. Retrieved March 1, 2022, from https://www.rtvoost.nl/nieuws/1499039/van-nederlands-planten-en-dierenrijk-is-85-procent-verdwenen
Xiaohong, Z., & Xingxing, L. (2011). Instantaneous re-initialization in real-time kinematic PPP with cycle slip fixing. GPS Solutions, 16(3), 315–327. https://doi.org/10.1007/s10291-011-0233-9
Appendix
Appendix I: Questions testing session iteration 1
- What do you think of the biodiversity score?
- What do you think of the maintenance score?
- What do you understand by a low, medium, and high maintenance score?
- What else would you like to see within the app?
- What is the added value of AR according to you?
- What functionalities are you missing?
- In what way would you like to use AR?
- Which version do you prefer?
Appendix II: Summary of feedback testing session iteration 1
- Complete questionnaire with:
- Questions about fruit and berry trees, colors, flowering period
- Option to answer “I don’t know”
- Maintenance score:
- Low: Water occasionally
- Medium: Prune small branches after bloom
- High: Give water daily, prune the whole hedge annually
- AR/non-AR comparison:
- AR makes the app more modern, innovative, inviting, and it sparks curiosity.
- AR gives you an idea of what to expect. You can see if it fits well with your garden or not
- AR gives more insight into possibilities
- Both testers indicate a preference for the AR version.
- Areas for improvement:
- Need for more information about the proposed plant
- Need to be able to indicate whether you like a plant or not
- See plants in different seasons
- Need to see more specimens of the proposed plant in AR
Appendix III: Questions testing session iteration 2
- To what extent do you need information from the application?
- What consequences do you expect when using the “Like” button?
- What consequences do you expect when using the “Dislike” button?
- In what way would you like to use AR?
- Which version do you prefer?
Appendix IV: Completed UEQ
AR prototype: Tester 1

AR prototype: Tester 2
Non-AR prototype: Tester 1
Non-AR prototype: Tester 2
Appendix V: Summary feedback testing session iteration 2
- Biodiversity score and maintenance score:
- Explanation of exactly what it means
- Areas of improvement:
- Summary of all my plants
- Not presenting a plant (or similar plants) anymore if user doesn’t like it
- Pollen allergy indicator
- Search for a plant and see if it fits within the garden
- AR:
- Seeing different types of plants together at the same time in
- Notification if the location where the user wants to put the plant is right for the needs of the plant
- Display the plant in real size
- Comparison AR/non-AR:
- AR is more entertaining than non-AR
- AR offers more possibilities. It is more interactive.
- With more functionalities AR could give better feedback
- AR has added value when the plant is displayed to full size
- Both testers indicate a preference for the AR version. This one encourages them better to act.