Premise
Creating a visual recommender system prototype which potentially can help to prevent filter bubbles on social media.
Synopsis
“If we want to know what the world really looks like, we have to understand how filters shape and skew our view of it.” Pariser, (2011, para.3). This quote perfectly reflects the issue of filter bubbles and echo chambers on social media. Filter bubbles are being created by online platforms’ algorithms. Personalization that suggests to users content that aligns with their interests, preferences, and beliefs, produces filter bubbles. Users are less likely to encounter opposing viewpoints, and this can lead to a polarized and divided society (Barberá et al., 2015). In this project, the potential of recommender systems is explored in mitigating the problem of filter bubbles on social media.
Substantiation
Background on Filter Bubbles:
The filter bubble is a phenomenon that refers to curating users’ feeds by social media platforms while using their algorithms to personalize users’ content which is based on previous online behavior. In this way users are often presented with a narrow range of content that reinforces their pre-existing beliefs and biases, resulting in making them less exposed to alternative perspectives (Pariser, 2011). The lack of diversity of information and “the subsequent polarization and fragmentation of the public debate” are the key issues of the filter bubble (Bodó, 2019, p. 208). The conducted research has presented that filter bubbles can have negative effects on individuals and society. For instance, a study provided by Bakshy et al. (2015) revealed that in most cases users tend to click on articles that confirm their political views which results in less exposure to opposing viewpoints. Similarly to that, another study by Flaxman et al. (2016, p. 299) found that social media algorithms often prioritize content that causes strong emotional responses, leading to the change of polarizing content and the spread of misinformation and fake news.
Social media and the problem with filter bubbles:
Recent statistics show that in the past 10 years (2012-2022) the daily time spent by online users on social networking is continually growing and in 2022 on average it was 147 minutes. It is around 63% more than a decade ago (Statista, 2022). Likewise, the situation is with the number of online users. In the next 5 years (2022-2027) the numbers are predicted to grow by a bit more than 1 billion and end up with around 5,85 billion online users (Statista, 2023). According to the research of the Pew Research Center (2022), around 70% of Americans were getting digital news from social media in 2022. Facebook was outpacing all other platforms with a result of 31%. However, users are often unaware that nowadays every social media has algorithms that on purpose show them content they are most likely to engage with. Thus the problem of filter bubbles has grown in significance in recent years too. Looking at the numbers given above, this can be a major problem. As a result, this brings serious consequences like misinformation, increased confirmation bias, polarization, and a decrease in empathy and motivation to learn (Dahlgren, 2021). Perhaps, the polarization of society is the biggest issue among them, together with increasing political division and a decline in civility in public discourse.
The Role of Recommender Systems:
Recommender systems are algorithms – filtering systems that focus on presenting personalized recommendations to their users. These are algorithms that suggest content to users based on their previous behavior and preferences. However, they can also be used as a potential solution to combat filter bubbles on social media platforms. Analyzing a user’s preferences, behavior, and social circle, can suggest new and most importantly diverse content that the user might not have encountered otherwise. This way the filter bubbles can be broken and users can be exposed to different viewpoints, leading to a more informed and open-minded society (Ricci et al., 2015).
Prototype
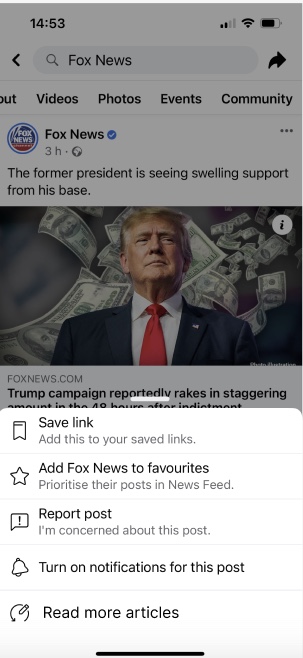
The prototype will focus on Facebook as a social media platform and the target audience will be people in age 25-34 as it is the biggest group of total Facebook users which consists of 30% (DataReportal, n.d.). Initial idea was creating a chatbot for Facebook Messenger app where any user could ask for related articles for their topic of interest. As a response, they would get several articles from trusted sources emphasizing how biased these sources are (left, right or center). During the research and consultations with a teacher, I made a decision to change the technology and skip these steps and make the process for users shorter. Now the story is that a user while scrolling the Facebook feed gets an article about some topic. It takes her/his attention and interest in what other media say about it. By clicking at “Read more articles” as if it is one of the numerous functions from Facebook, for example just like “Report post”, in the new tab would pop up my recommender system which shows how biased the current article is and suggests to choose other news with different perspectives.
Iteration 1
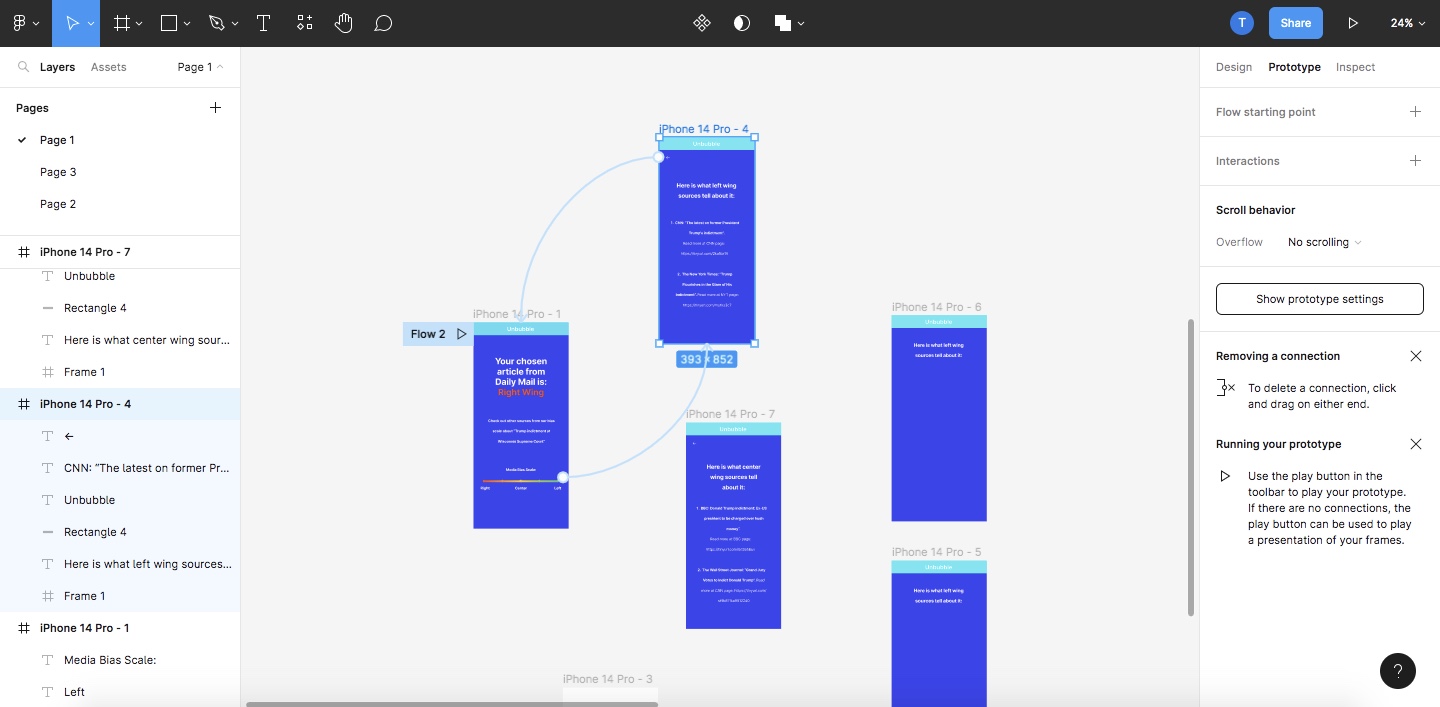
The first iteration was planned for exploring technology and tools for creating a visualization. In the end I decided to use Figma for prototyping. After learning how it works and experimenting with it, step by step it became clear for me in which format I want to make it and what should be included in it. This part was very much about the creative process.
Insights:
- As people mostly use Facebook on their mobile phone, the format of the prototype will be created in a mobile version
- No extra text, it must be clear and short, so the user does not get tired just while reading through recommender system
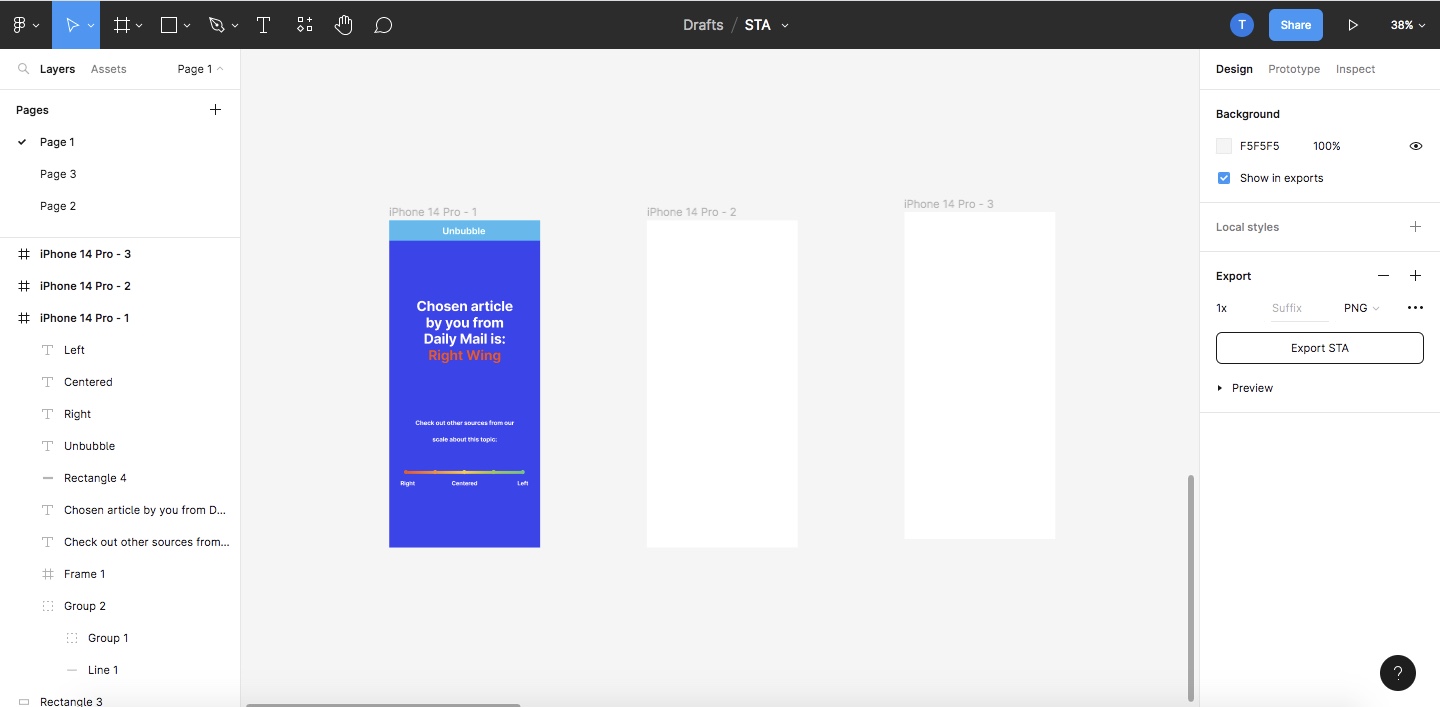
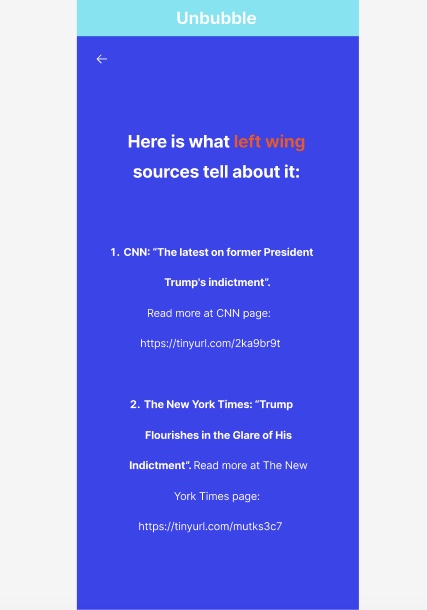
- Recommender system as any program should have a name, so as a main goal of my recommender system would be to break a filter bubble I named it “Unbubble”
Iteration 2
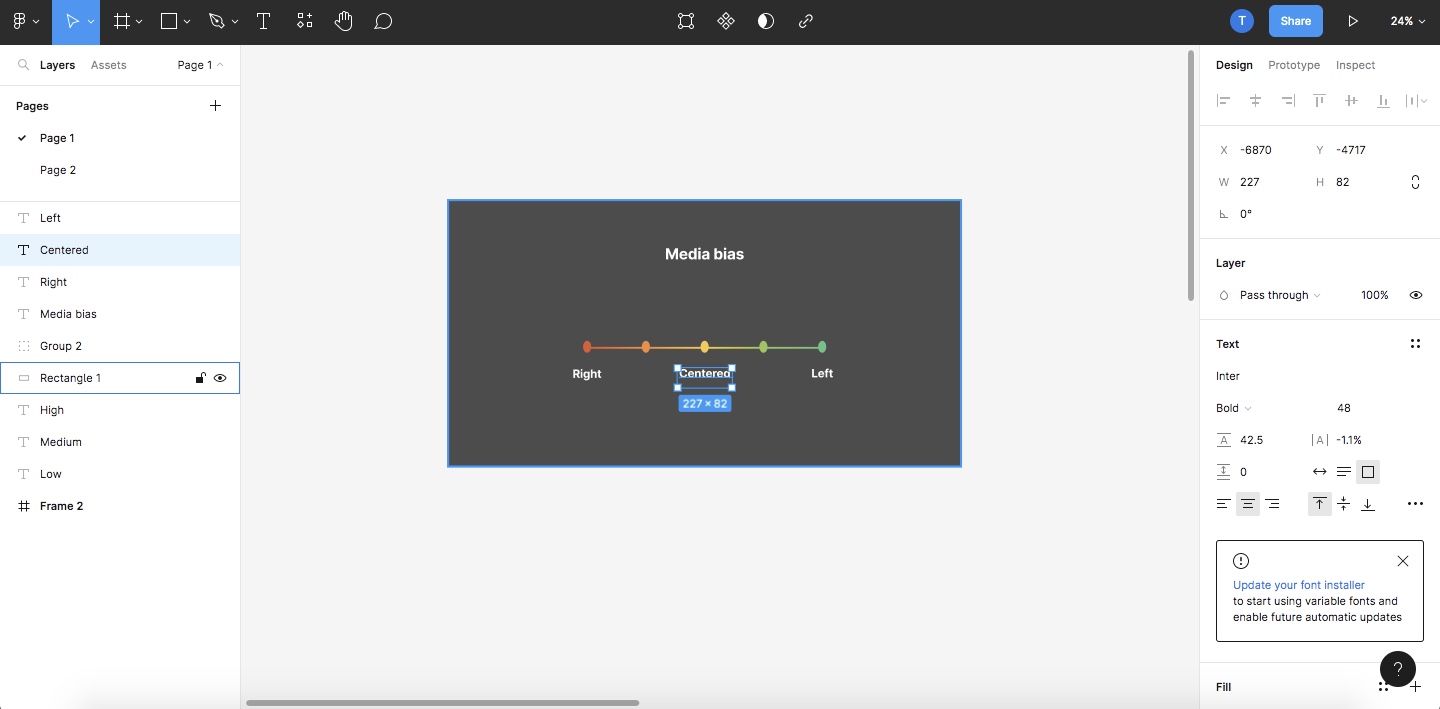
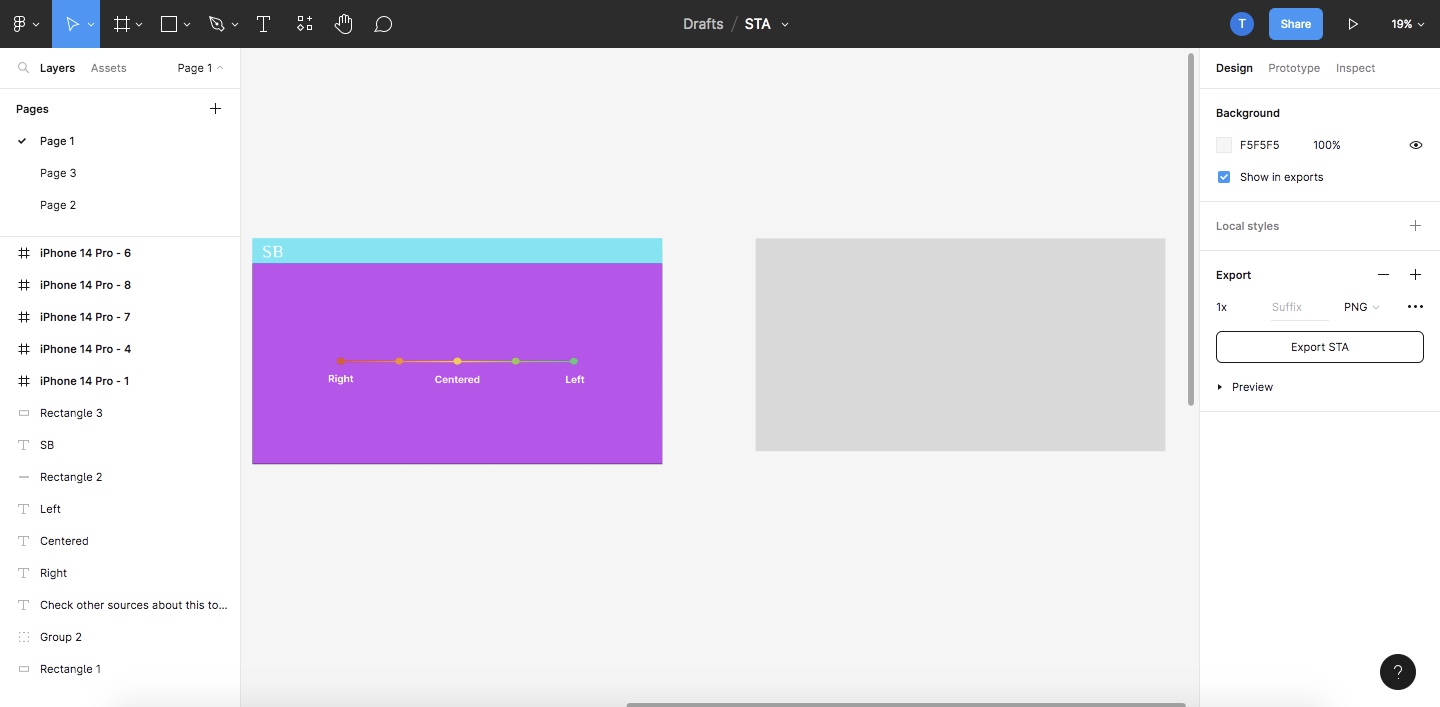
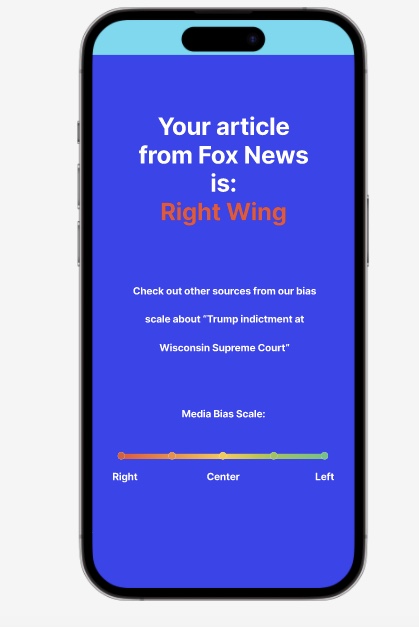
For the second iteration of my prototype, I continued developing the interface but also mainly focused on the content. What has to appear at the home page, how to recommend news without overwhelming the user and not to cause information overload. How can I show to my user that the article was biased and suggest news sources from another predisposition? To show the filter bubble I decided to include the “Media Bias Scale” on which there are 3 main types: right, center, left. When I finished my first version of the prototype, it was tested by 2 young adults that are included in my target audience.
Insights:
- It is easier for people to see visually the media bias, just like it was presented on Media Bias Scale
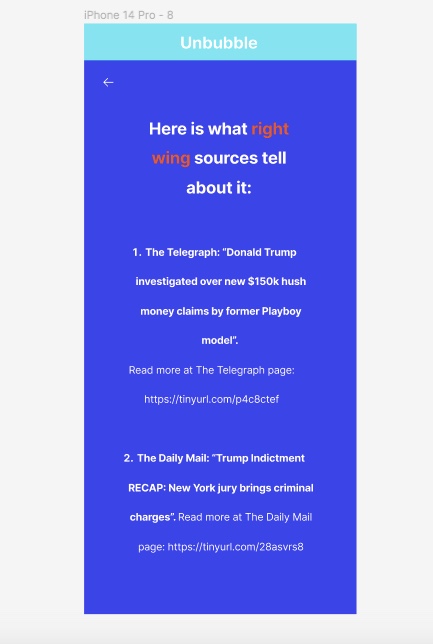
- It is very important to emphasize how biased is the source on every stage, whether it was at the moment the user was suggested an article by Facebook or when Unbubble suggests it
- There must be included not only the source and the title, but also the link to the source with a full text
Iteration 3
After receiving the users’ feedback, some additional features were incorporated into my prototype. For example, it was mentioned that it is very important for them to know how actual is information recommended to them by the Unbubble. Of course, there were also suggestions on the design of the interface and how it can be more engaging and user-friendly. This is something that would come in the further stage of prototype development. But so far, it was most important to hear what users think about this solution and if it helps to break the filter bubble of content they see on social media.
Insights:
- Users find recommender system an interesting and easy tool to see other articles with different perspectives
- It is very important to have a choice among different articles for users, especially for those that look for diversity and want to break filter bubble
- There can be added also images that were also used for the articles to make it visually user-friendly
Conclusion
This prototype is just a visual sketch about how this recommender system would look and how it would work. For further development, based on users’ feedback there are still a lot of details that can be added to it. Moreover, to build a true recommender system there is also coding and creating a whole dataset with scraped data required. For now, it was important to show the idea and which way it would be created to solve the problem of filter bubbles. My theoretical research and user testing proved that this problem exists on a big scale and society needs it to be solved. According to user’s that tested the prototype, as a starting point of this tool it is workable and meets its initial goals but is also possible to improve to make it more advanced.
A link to my prototype on Figma: https://www.figma.com/proto/i7N3A0Yv7iZEcjNxZXBWpS/STA?node-id=14-112&scaling=scale-down&page-id=0%3A1&starting-point-node-id=9%3A41&show-proto-sidebar=1
References
Bakshy, E., Messing, S., & Adamic, L. A. (2015). Exposure to ideologically diverse news and opinion on Facebook. Science, 348(6239), 1131.
Barberá, P., Jost, J. T., Nagler, J., Tucker, J. A., & Bonneau, R. (2015). Tweeting from left to right: Is online political communication more than an echo chamber?. Psychological science, 26(10), 1539.
https://doi.org/10.1177/0956797615594620
Bodó, B., Helberger, N., Eskens, S., & Möller, J. (2019). Interested in diversity: The role of user attitudes, algorithmic feedback loops, and policy in news personalization. Digital journalism, 7(2), 208.
https://doi.org/10.1080/21670811.2018.1521292
Dahlgren, P. M. (2021). A critical review of filter bubbles and a comparison with selective exposure. Nordicom Review, 42(1), 17.
Flaxman, S., Goel, S., & Rao, J. M. (2016). Filter bubbles, echo chambers, and online news consumption. Public opinion quarterly, 80(S1), 299.
https://doi.org/10.1093/poq/nfw006
Global daily social media usage 2022 | Statista. (2022, August 22). Statista. https://www.statista.com/statistics/433871/daily-social-media-usage-worldwide/
Number of worldwide social network users 2027 | Statista. (2023, February 13). Statista. https://www.statista.com/statistics/278414/number-of-worldwide-social-network-users/
Pariser, E. (2011). The filter bubble: What the Internet is hiding from you. Penguin UK, para. 3.
Pariser, E. (2011). The filter bubble: What the Internet is hiding from you. Penguin UK.
Ricci, F., Rokach, L., & Shapira, B. (2015). Recommender systems: introduction and challenges. Recommender systems handbook, 20.
https://doi.org/10.1007/978-0-387-85820-3
Social Media and News Fact Sheet. (2022, December 14). Pew Research Center’s Journalism Project. https://www.pewresearch.org/journalism/fact-sheet/social-media-and-news-fact-sheet/
The Latest Facebook Statistics: Everything You Need to Know — DataReportal – Global Digital Insights. (n.d.). DataReportal – Global Digital Insights. https://datareportal.com/essential-facebook-stats