Premise
Creating healthier cycling commutes using crowdsourced IoT

GitHub: https://github.com/philffm/FreshAir
Figma Concept: https://www.figma.com/proto/
Synopsis
The global climate and health crisis is affecting everyone and from 2030 and 2050 is expected to account for “250 000 additional deaths per year.” (World Health Organization (2021)
Air pollution, which poses a major challenge in most emerging economies, is an invisible, yet integral part of this crisis
But how can we make this invisible health threat more visible for society – and in the next step make them learn & reflect on it?
Substantiation
My overall topic deals with the question on how we might raise awareness in society on the invisible air pollution – and in the next step let people on bicycles choose the least polluted commute using crowdsourcing-enabled IoT technology.
Within the course “State of the Art Technology” I was focussing on the first part of this question, on how we might create awareness using an IoT device, as well as building the technical foundation for what comes next: The graduation project.
Microcontrollers for IoT projects have been getting more affordable and accessible to consumers than ever before. During this course, I took the opportunity of getting prepared for the technical challenges and obstacles of working on such physical prototypes. I did this by exploring the technology, revised the coding syntax of C++ (Arduino), finding out how suitable and reliable today’s consumer sensors are for measuring such data and developed an MVP technology stack for as means of foundation for my graduation project.
Testing with potential users sparked new ideas on how to increase privacy and how to create more meaningful interactions in the final prototype. Collecting air pollution data in the field and evaluating it created demand for testing more sensors for potentially increased precision in the graduation project.
Overview of prototypes
Iteration 1: Paper Prototypes & TinkerCad
This first iteration consisted primarily of building a rough story line based on the given “How might we…”-question as well as prototyping the required sensors for a technical foundation.
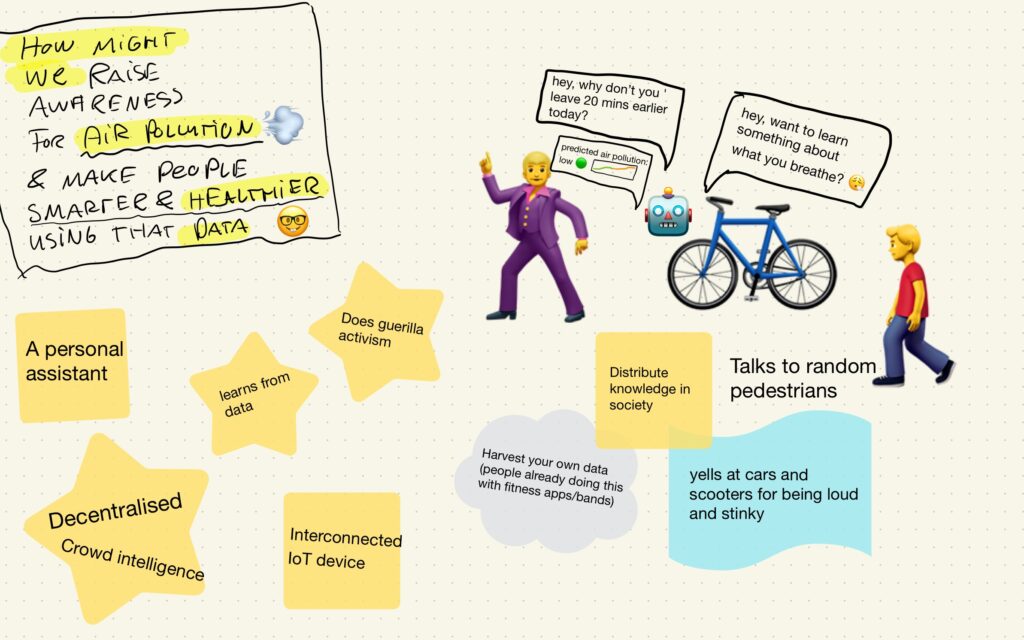
Paper prototype 1: A rough concept
Very few products experienced market maturity in the first iteration. And this is especially true for IoT prototypes: Wildly plugging cables together in the first iteration doesn’t do much good.
That’s why I started from scratch – on paper illustrating very roughly how to bring the data to life in public, while addressing multiple potential users at once.
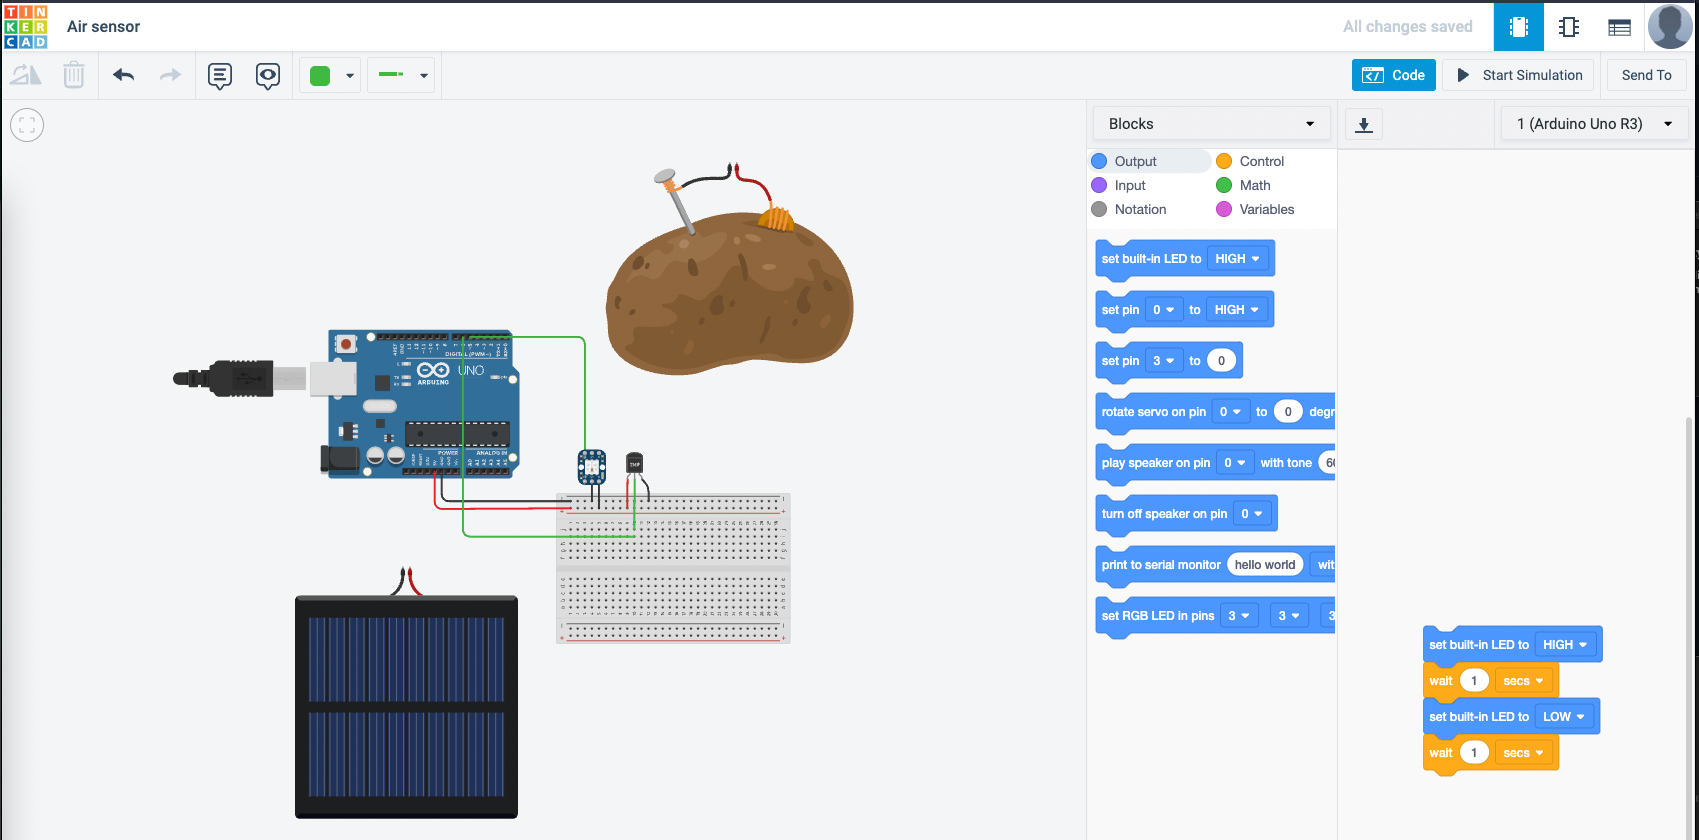
Technical paper prototype 1: Playing with TinkerCad
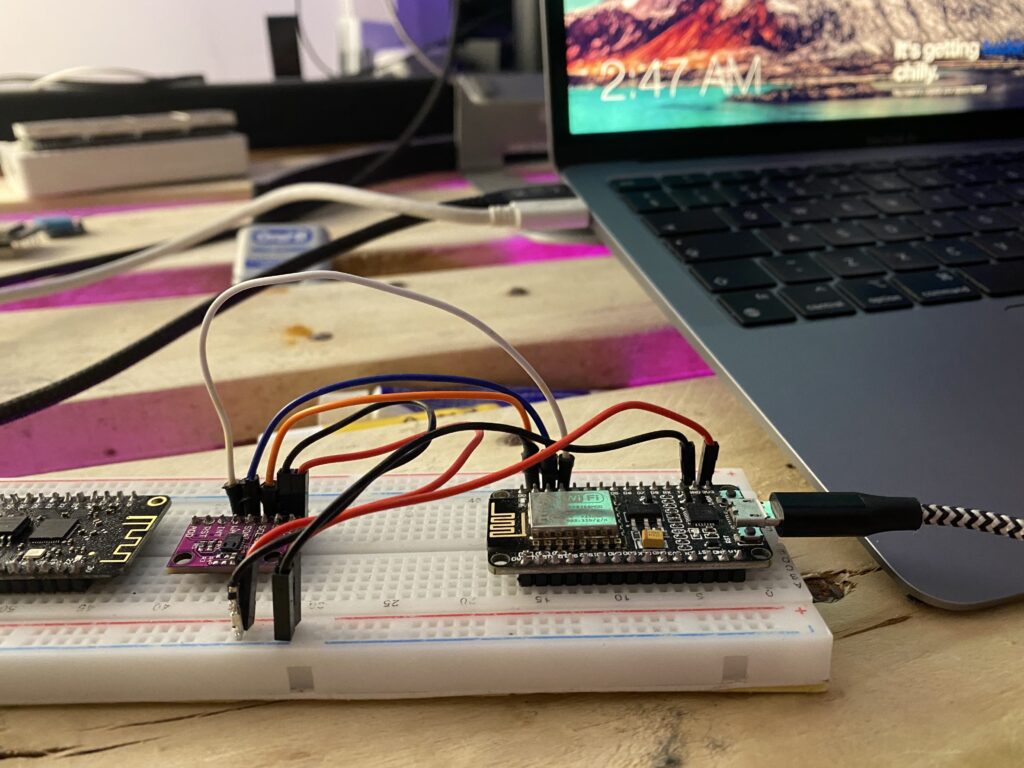
Iteration 2 – The first test run: Reading data from sensors locally
- ESP8266 Module (Works like an Arduino Uno)
- WiFi
- CCS811 CO2 Sensor
- Serial logging via. USB
Feedback gathered from internal testing was primarily about the aspect that that there should be a direct feedback given from the IoT device – because: The only way to get data from the device so far was by reading its serial output.
But what makes the most sense here? Outputting the live data in numbers? Lights? Using voice output?
Iteration 3: WiFi Connection, Google Sheets & LED
Logging the data – from the micro controller straight into Google SheetsIn addition, I added an LED that glows green to red on the spectrum from 400 to 800 PPM (CO2).
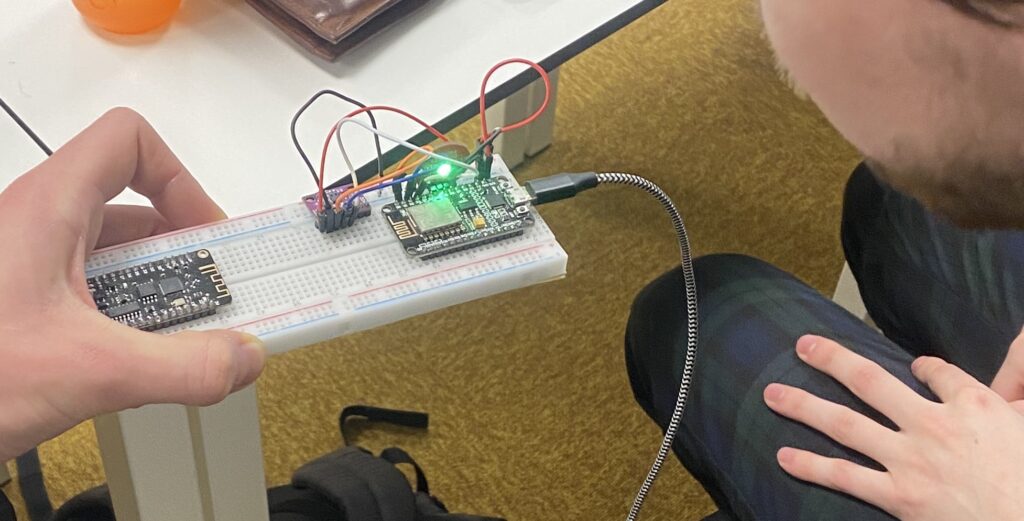
During the user testing we found that the LED is already a very suitable choice to visualise the air quality in context. What was often mentioned is that lights were “much less distracting than, for example, a display with numbers”. This is an important factor to consider when it comes to a gadget that is used while riding, where driving safety is a top priority.
However, one important point that was mentioned was about learning from the data: Users would like to see the data available also after the ride – and possibly make them available also to others.
Testing in the wild
While I have already been tracking data with the sensor in my backpack due to Dutch weather conditions 🌧 (and a device that was not yet rain-proof), I also wanted to start a first test ride with the device mounted on the bike.
After testing the (now exposed) device for 10 minutes outside, one of the first cyclist (and potential user) at a traffic light approached me:
“What’s that device you have there?”
I replied “What would you guess?”
He initially suspected a distance meter for overtaking cars. A good thought – my hint that it is about visualising something invisible finally brought him to air pollution.
This first spark of interest from someone external raised my curiosity in conducting more user testing with people on the street (and I can’t stress this enough, since forcefully asking fellow students, friends and flat mates for feedback is something I’ve grown way to tired of after several years of “you have to conduct user testing” – especially during corona, where research was rather experimental and the ability of approaching random people in public needs to be relearned by many.).
Therefore I’m looking forward to testing the next prototype iterations in real life, making the device as eye-catching as possible, and also incorporating a way for user feedback that doesn’t require my presence.
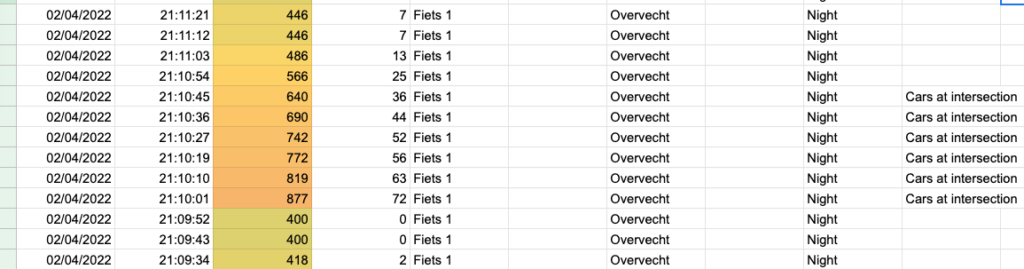
Exciting to see: The sensors do indeed output higher values for cars passing by, even with this 3$ sensor.
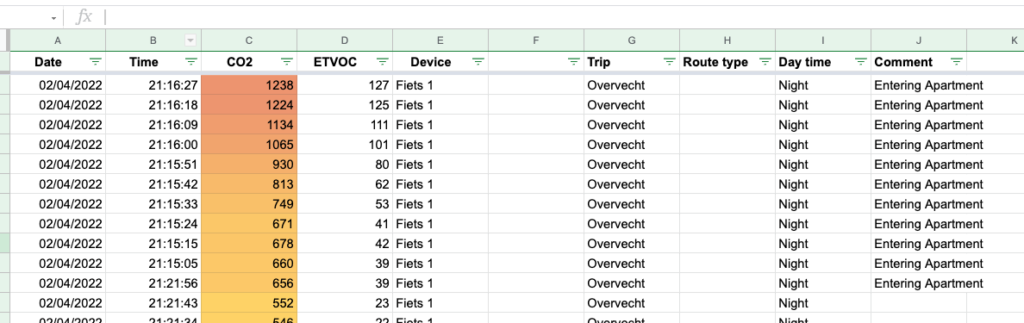
Outliers: The values skyrocket as soon as I enter my apartment. This is probably because cheaper sensors work with air pressure – unlike higher-quality sensors such as the PMS5003, which works with laser particle measurement and is due to be tested in the next stage.
Future Concept – What is this all about?
What I tested here as part of SAT is just one piece of the puzzle of an entire ecosystem. Want to see more? Here are slides.
Conclusion
Another valuable insight I will further investigate and focus on during my graduation project is the user interaction.
So far, the focus has been primarily on one user – and one context: the cyclist himself – while riding. But what about interaction with other people? Who else could be part of the ecosystem by (first-time) interacting with it, and explore or contribute data to it in what ways?
I’m excited about the experiences and insights I’ve gained – and I’m looking forward to learning more in the graduation project.