Premises
An interactive soundscape that makes the influence of the current and future financial economy on our daily lives tangible.
Synopsys
This project explores the possibilities to engage with data and veiled financial matter via sound. Worried about the influence of the almost rampant financial system, I embark on a journey to where thoughts and technology try to manifest a sonification, and in its ultimate form, the Speculative Symphonies.
Groundwork
“When the last tree has been cut down, the last fish caught, the last river poisoned, only then will we realise that one cannot eat money.”
– Alanis Obomsawin, 1972
Even this dim scenario did not consider a future in which there might be even less materialised forms of value than money in the form of paper and coins. All of which we cannot eat, nor burn or, for what it is worth, throw in a wishing well.
Financialisation
The transformation of value to the more abstract spheres of our economy appears unstoppable. It is part of a larger capitalism phenomenon called financialisation.
Financialisation can be defined as “the increasing importance of financial markets, financial motives, financial institutions, and financial elites in the operation of the economy and its governing institutions, both at the national and international levels” (Mader et al., 2020, p. 6).
Although the term financialisation is useful for describing contemporary capitalism developments, it remains abstract, remote, complex and mainly finds its existence in figures and charts. At the same time, it influences all aspects of our lives, like our housing, our life choices (De Vita & Luo, 2020, p. 18), our democracy (Mader et al., 2020, ch. 35. ) and our ecology (Clark & Hermele, 2013, p. 65-66).
Sonification
This project researches the possibility to connect to the issue of financialisation emotionally by using sonification techniques (Grond & Hermann, 2014, p. 50). As an aural form of data visualisation, sonification can humanise information, especially when it comes to large datasets and complex matters. Also, sonification can provide means by which listeners can obtain new ideas about the data (Lenzi & Ciuccarelli, 2020, p. 2).
Concept diary
1. Research: Features of financialisation
Since financialisation is a catch-all term, I need to make the subject more granular and find an angle to investigate.
Thoughts: In finance, money is made from the circulation of money. As if it can materialise from itself. Also, can we view capital markets as a net, as a layer over our society? How are they manifesting? Evoking the spreading and displacement of things and being?
(Conceptualising)
2. Technology: First sonification with TwoTone
TwoTone is a tool to make a sonification out of a dataset. For experimental purposes, I choose a dataset with data about abstract subjects: US Historical Revenue, Public Debt and GDP.
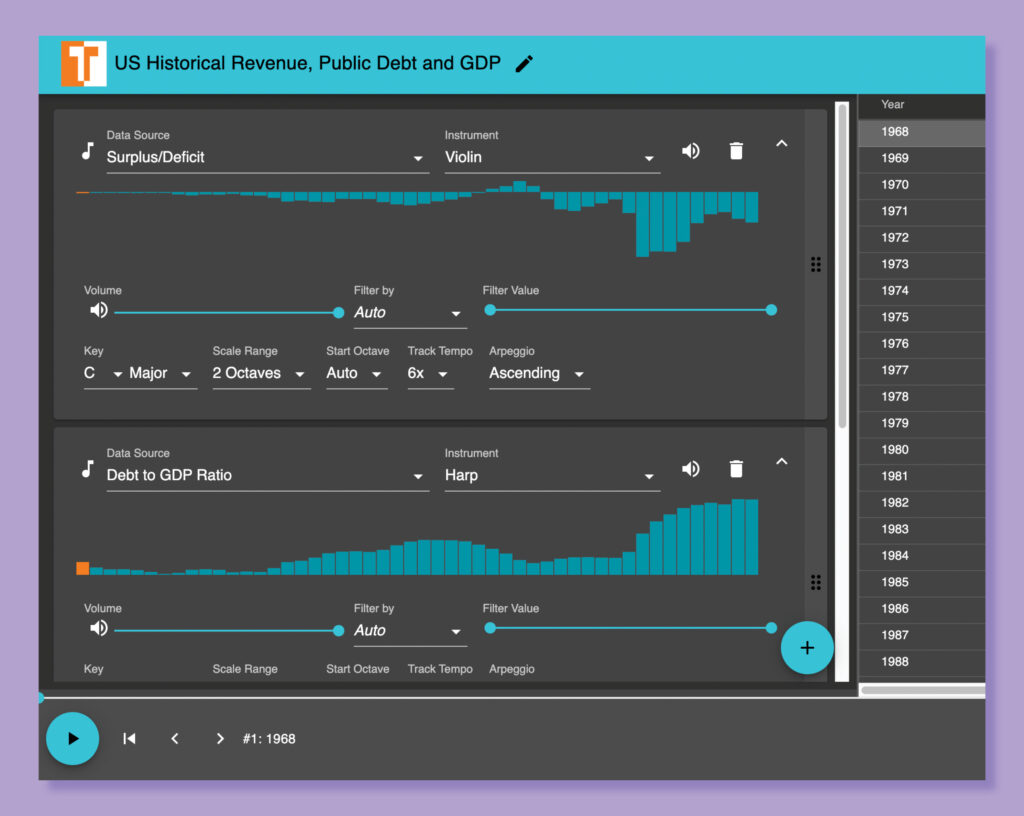
(TwoTone interface)
Thoughts: It was exciting to try out all the application functions and play around with different instruments and metrics. Yet, without context (which could also be the name of the file), it is impossible to understand the data. Also: how do the musical parameters such as arpeggio (descending/ascending), the scale range, or the key relate to the data?
3. Research: How to grasp the influence of the financial markets?
Thoughts: Stock Exchanges can be seen as the “broadcasters” of the financial system. This angle gave me the following idea: a sonification of the performance ( in sound) and market capitalisation (in volume) of the 25 largest stock exchanges (per continent) in a sound installation, in a space, either digital via augmented reality or physical?
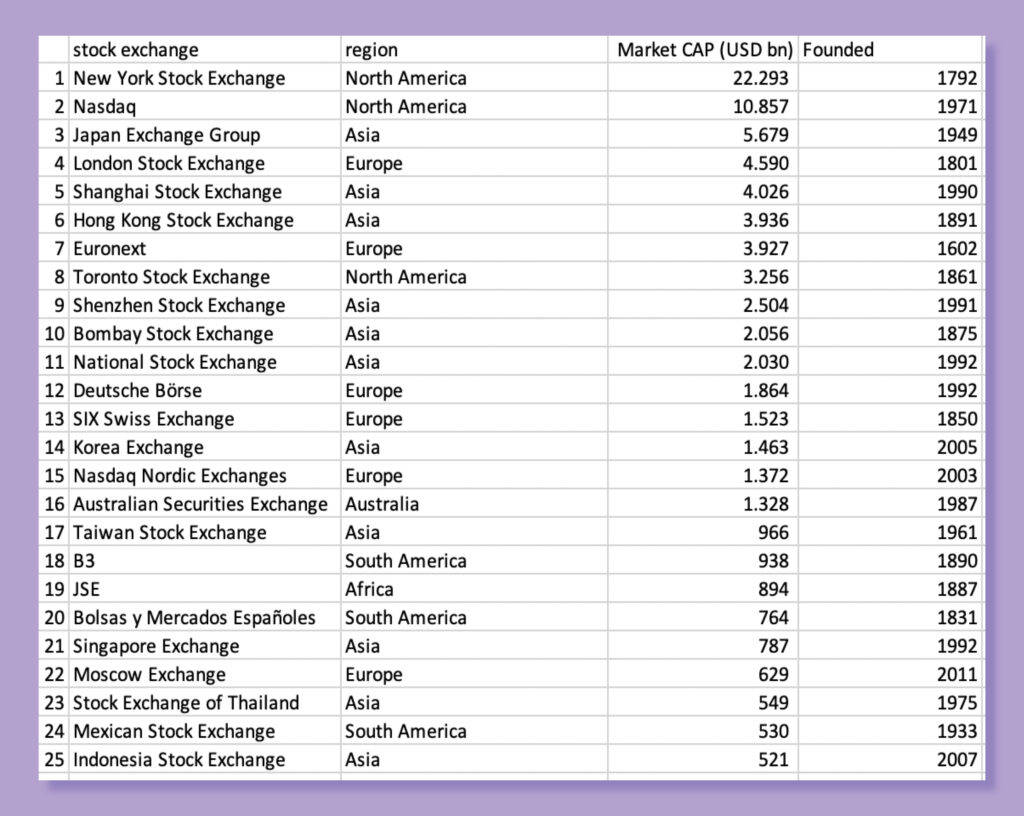
(The biggest stock exchange’s in the world)
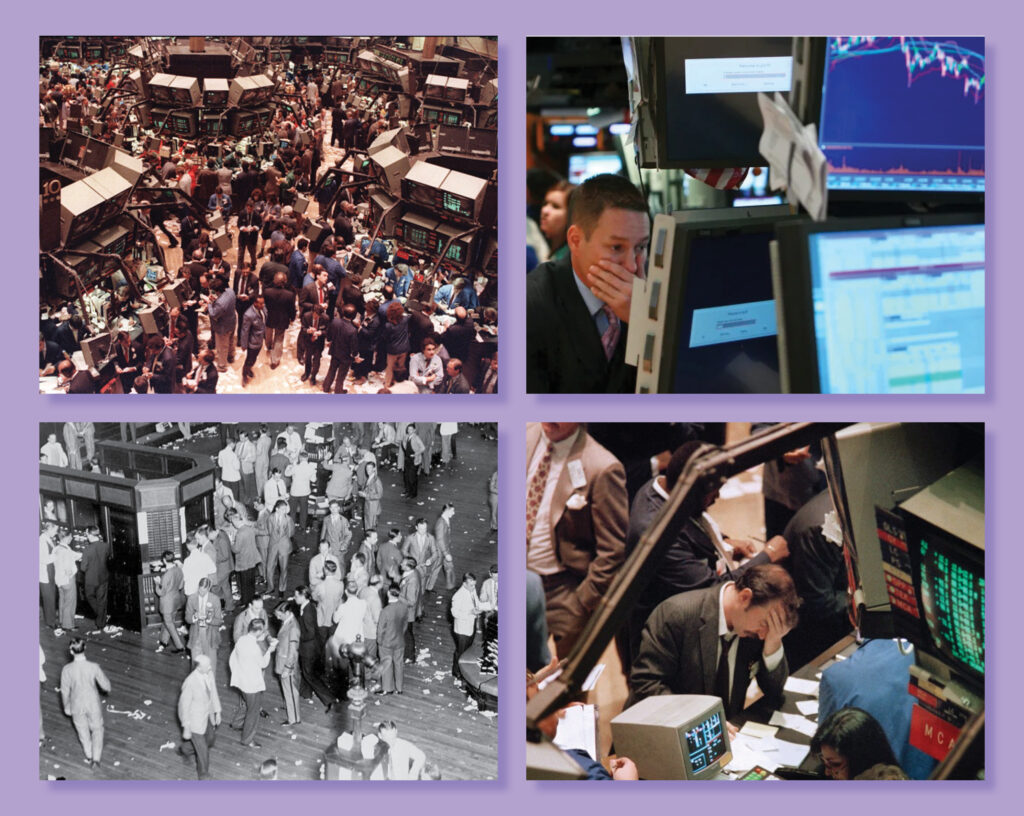
(Happenings)
4. Technology: Making sound choices
Since I had decided on the angle, I collected the 25th largest stock exchanges’ performance data via Yahoo Finance and turned them into tracks.

(Performance NYSE and B3)
Some of this data dates back to 1985, leading up to a pretty dreadful sonification. The problem is that since the music is so linear, it is hard to hear trend in the markets’ developments.
Feedback data scientist/musician
I decide to ask a data scientist, who is also a musician, for feedback. He mentioned that a symphony consists of different parts, as a story in chapters. When it came to represent the different continents, he recommended listening to Prokofiev’s Peter and the Wolf, in which different instruments represent the various characters.
Thoughts: Stock Exchanges – look into stock cycles as if it were a symphony. What would be the different chapters? How would the story begin or end?
5. Research: plotting the story
If you look at the data of the US stock markets, you notice the following:
- build-up from 2003 till peak moment in November 2007
- followed by straight decline till September 2008
- then straight crash till low point in march 2009 (more than half of the stock value gone)
- a bumpy road up till the beginning of 2020
I decided to use the data of what could be perceived as a complete stock cycle: from 2003 – 2010. Based on ‘Wallstreet psychology’, I identified stages of the stock cycles and emotions identified with these cycles, and used this data to generate tracks.
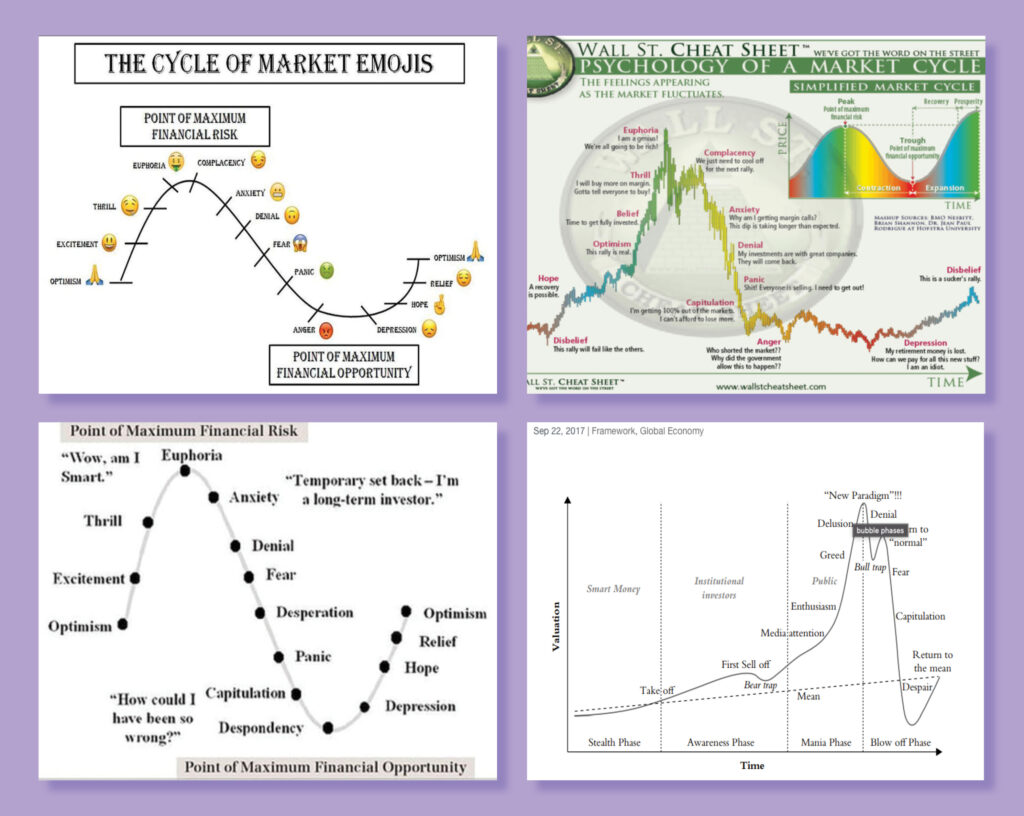
(Emotions)
Thoughts: If you look at the current situation, it seems like the numbers are going up? Are we on our way to building a new bubble? How does a financial crisis emerge? It is sometimes hard to tell; it has never been clear why, for example, the US’s markets crashed in 1929.
6. Technology: sounds of enthusiasm and delusion
To experiment with the symphony parts, I decided to sonify the curve from the point of hope, optimism, belief, thrill, euphoria (the end).
After trying out different parameters, I figured the track was still too long. Maybe I should split it up: a track of hope/optimism and a track of thrill/euphoria. Also, the choice of instruments is based on a classic orchestra’s positioning, where I chose to place the market with the largest cap in the front; therefore, it is the violin.
The above track was based on observation of the curve, but I felt it was off. By listening to the data again, I heard where it was off and decided to move that part of the data to an earlier part of the symphony. The next version is the same part, with the same parameters, only with the rising data, and the difference in tone and build for me is striking. This is an interesting feedback loop between hearing the data and then ‘tweaking’ the data and hearing it again.
Other experiments (o.a on timing and interval):
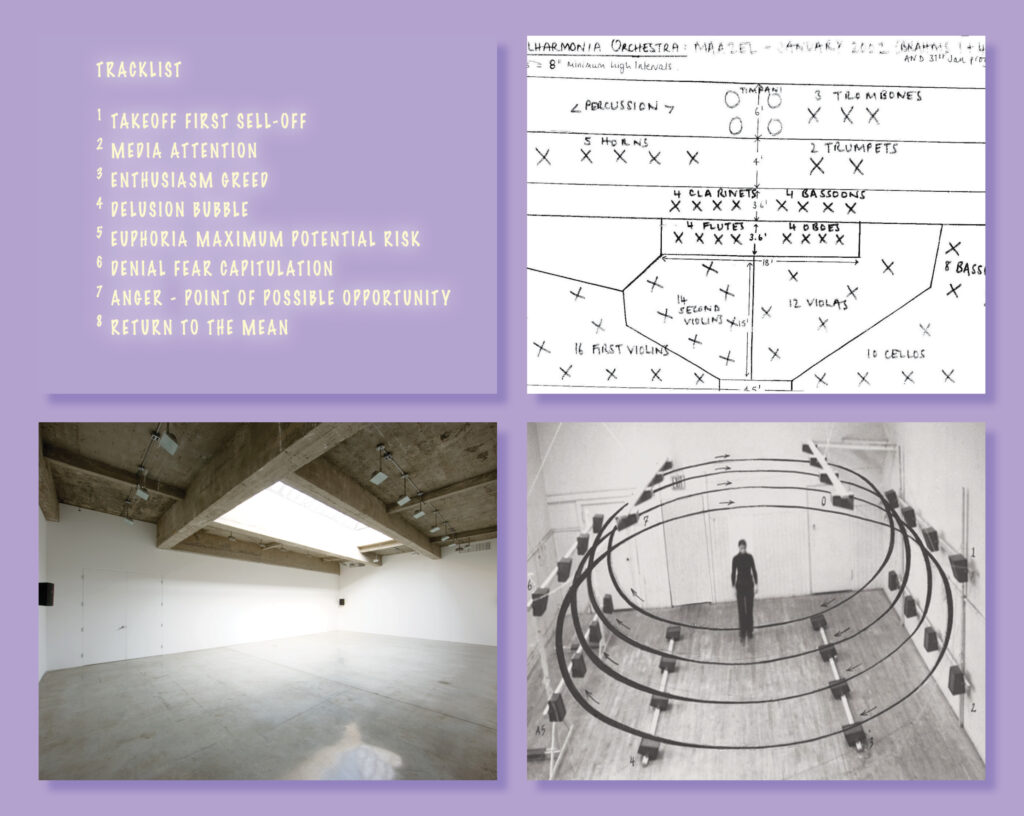
(Above works by Hugill, Leitner and Philipsz)
Thoughts: How does the symphony end? We are in uncertain times currently. Can the public complete the symphony themselves? Speculative symphonies? The reaction of the public should create new data to be sonified, but what is the cue? Actors buying or selling?
7. Research: Touchdesigner
TouchDesigner is a node-based programming language for real-time interactive content.
Feedback by peers
When I proposed the idea of speculative sympathy to fellow students, they gave the feedback of providing a visual cue of making the public aware of the opportunity to interfere at a certain point.
To influence the installations and let the public bring future speculative scenarios to life, I decided to experiment with visuals.
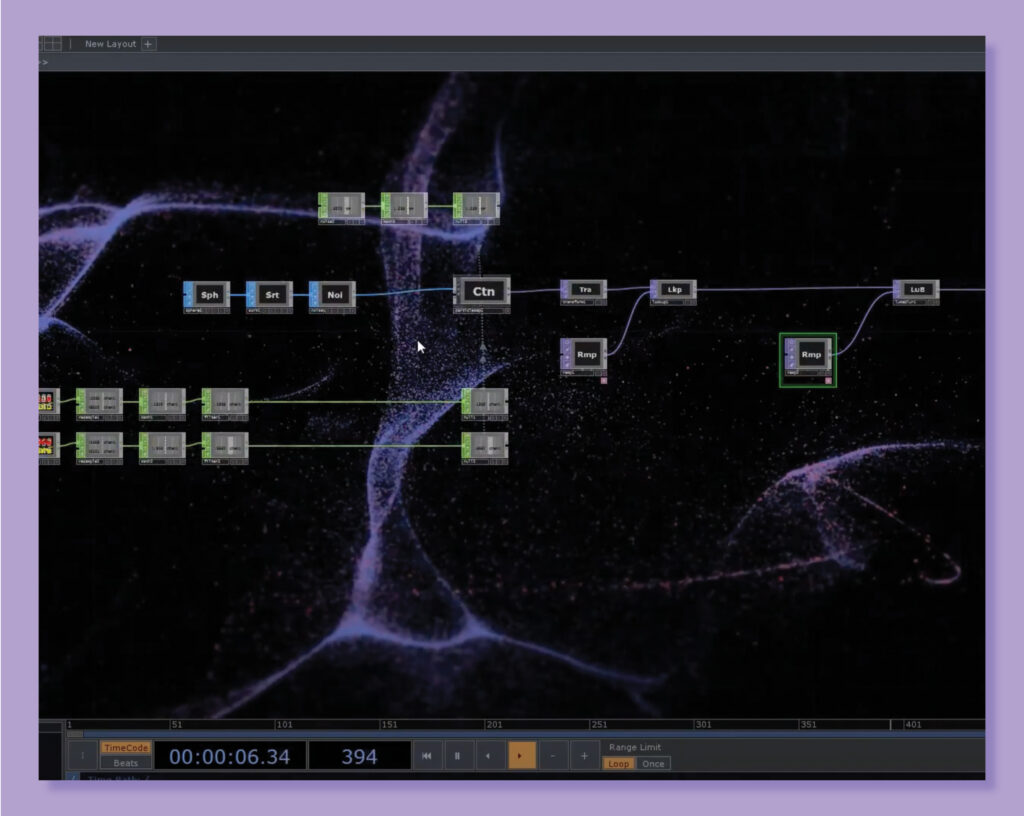
(Moving particles)
[aesop_video src=”self” hosted=”https://cmdstudio.nl/mddd/wp-content/uploads/sites/58/2021/03/touchdesigner.mov” align=”center” caption=”Experiment in TouchDesigner with audio and sound” disable_for_mobile=”on” loop=”on” controls=”on” mute=”off” autoplay=”off” viewstart=”off” viewend=”off” show_subtitles=”off” revealfx=”off” overlay_revealfx=”off”]
Thoughts: it is interesting to imagine how the public can add a layer to the visual by simply walking in, but conceptually it feels off to use visuals, and also, the crowd can not manipulating the audio itself. This observation makes me decide to continue using only audio.
8. Technology: SuperCollider
SuperCollider is a platform for audio synthesis and algorithmic composition used by musicians, artists, and researchers working with sound.
To let users generate parts of the symphony, I needed a tool to make software that a spectator of the installation could use. For this, I experimented with SuperCollider and programmed a surface where a mouse could move around and influence a tone’s pitch.
[aesop_video src=”self” hosted=”https://cmdstudio.nl/mddd/wp-content/uploads/sites/58/2021/03/supercollider.mov” align=”center” caption=”Experiment in SuperCollider with sound and interactivity” disable_for_mobile=”on” loop=”on” controls=”on” mute=”off” autoplay=”off” viewstart=”off” viewend=”off” show_subtitles=”off” revealfx=”off” overlay_revealfx=”off”]
Thoughts: This program is interesting but too complicated for me since it requires me to learn a new programming language.
9. Technology: Max 8
Max 8 is software that can connect every input to every output to create interactive software.
I got the advice to try Max to build a user interface that could work with data. I experimented and see the possibilities; this tool seems the right one for the job. Although, when it comes to execution, I am just not there yet.
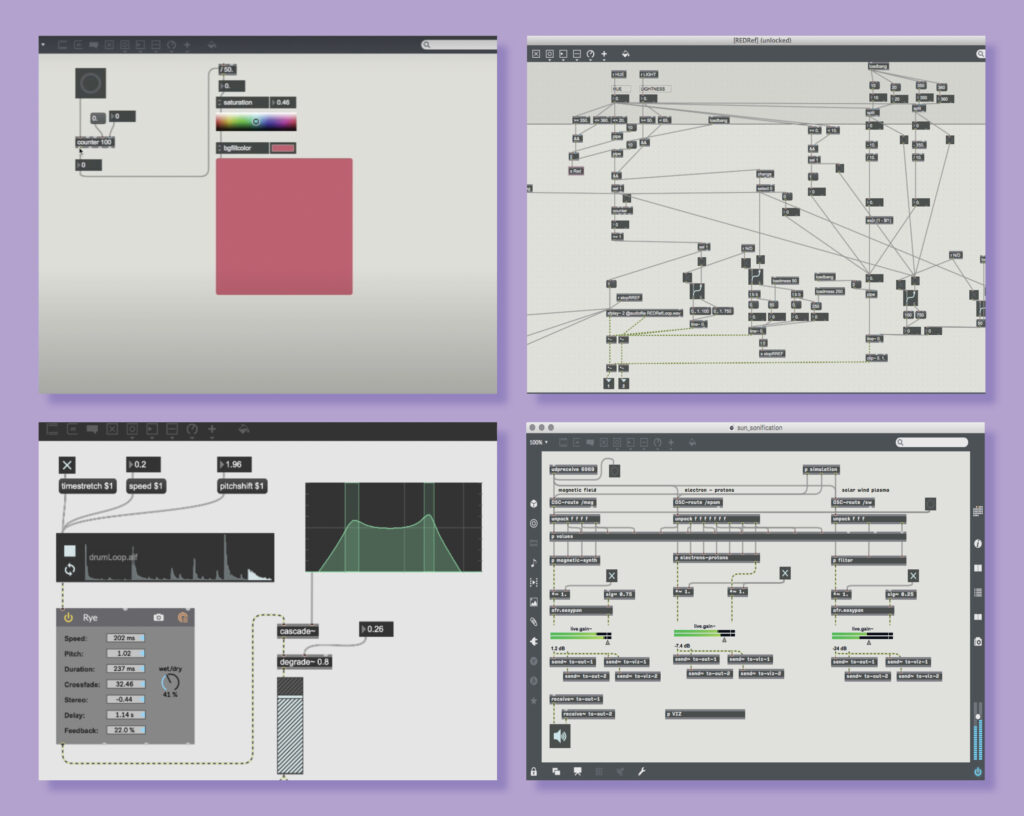
(What I did (upper left corner) vs. what you can do)
Thoughts: I would love to experiment further and visualise how I can use this tool in an installation.
10. Conclusion
Working with sound is very different from working with visuals. I found data conversion to multiple instruments, sound levels, tones, pitches, and scales quite overwhelming. Another big difference: a visual relates to a surface, but sound relates to time.
This project also took a lot of effort to conceptualise since both the means (sonification) and the message (financialisation) are complex matters. I am currently trying to discover, by experimenting and making, how to make something interactive. The concept will also evolve as the process of making continues.
What this process taught me most of all is that there are endlessly more possibilities when you look outside of your comfort zone.
References
Text and images
Clark, E., & Hermele, K. (2013). Financialisation of the environment: A literature review (FESSUD papers ed., Vol. 17). FESSUD. https://portal.research.lu.se/ws/files/3077365/4361629.pdf
De Vita, G., & Luo, Y. (2020). Financialization, household debt and income inequality: Empirical evidence. International Journal of Finance & Economics, 15–18. https://doi.org/10.1002/ijfe.1886
Grond, F., & Hermann, T. (2014). Interactive Sonification for Data Exploration: How listening modes and display purposes define design guidelines. Organised Sound, 19(1), 41–51. https://doi.org/10.1017/s1355771813000393
Hugill, A. (n.d.). The Orchestra: A User’s Manual – Seating. The Orchestra: A User’s Manual. Retrieved 10 March 2021, from https://andrewhugill.com/OrchestraManual/seating.html
Leitner, B. (n.d.). Sound Spaces [Sound installation]. https://www.archdaily.com/168979/bernhard-leitner-sound-spaces
Lenzi, S., & Ciuccarelli, P. (2020). Intentionality and design in the data sonification of social issues. Big Data & Society, 7(2), 1–2. https://doi.org/10.1177/2053951720944603
Mader, P., Mertens, D., Zwan, N., & van der Zwan, N. (2020). Financialization: An introduction. In The Routledge International Handbook of Financialization (pp. 6–7). Taylor & Francis. https://doi.org/10.4324/9781315142876
Philipsz, S. (n.d.). Here Comes Everybody [Sound Installation]. Tanya Bonakdar Gallery, New York. http://artpulsemagazine.com/susan-philipsz-sound-as-invisible-sculpture
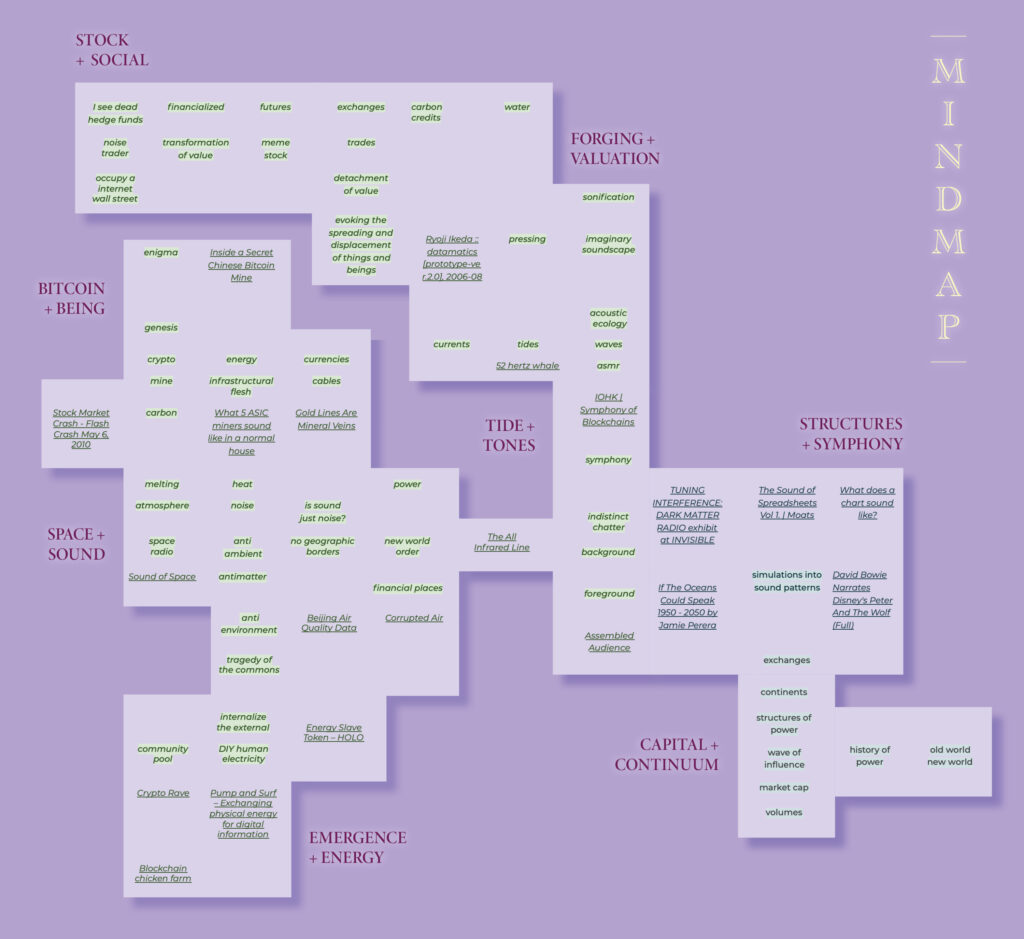
Mindmap
Air Play – Smog Music Created With Beijing Air Quality Data. (2015, March 18). [Video]. Vimeo. https://vimeo.com/122603843
Baraniuk, C. (2015, April 15). The world’s loneliest whale may not be alone after all. BBC. http://www.bbc.com/earth/story/20150415-the-loneliest-whale-in-the-world
Corrupted Air – Future Gallery • Femke Herregraven. (n.d.). Femke Herregraven. Retrieved 3 March 2021, from http://femkeherregraven.net/corrupted-air-future-gallery/
David Bowie Narrates Disney’s Peter And The Wolf (Full). (2019, February 24). [Video]. YouTube. https://www.youtube.com/watch?v=Va8Uz6MoKLg
DISNOVATION.ORG & Baruch Gottlieb. (2020, December 4). Energy Slave Token. HOLO. https://www.holo.mg/dossiers/imal-post-growth/energy-slave-token/
Gold Lines Are Mineral Veins. (2014, October 18). [Video]. Vimeo. https://vimeo.com/110965073
If The Oceans Could Speak 1950 – 2050. (n.d.). SoundCloud. Retrieved 3 March 2021, from https://soundcloud.com/jamieperera/if-the-oceans-could-speak-1950-2050
Imamovic, M. (2019, November 11). Cryptorave-an interview with Omsk Social Club + !Mediengruppe Bitnik by Maisa Imamović. Network Cultures. https://networkcultures.org/moneylab/2019/11/11/cryptorave-an-interview-with-omsk-social-club-mediengruppe-bitnik-by-maisa-imamovic/
Inside a Secret Chinese Bitcoin Mine. (2018, October 28). [Video]. YouTube. https://www.youtube.com/watch?v=mQWAT98D1HU
IOHK | Symphony of Blockchains. (2018, January 29). [Video]. YouTube. https://www.youtube.com/watch?v=f0Pzg50QnI4
Moats, D. (2019, November 11). The Sound of Spreadsheets Vol 1., by. Moats. https://davidmoats.bandcamp.com/album/the-sound-of-spreadsheets-vol-1
NASA. (2017, October 28). Spooky Space ‘Sounds’. https://www.nasa.gov/vision/universe/features/halloween_sounds.html
Ryoji Ikeda :: datamatics [prototype-ver.2.0], 2006–08. (2013, March 20). [Video]. Vimeo. https://vimeo.com/62242278
Smith, A. (2019, November 13). What does a chart sound like? Financial Times. https://www.ft.com/content/a5772530-e440-11e9-b8e0-026e07cbe5b4
Stock Market Crash – Flash Crash May 6, 2010. (2011, November 3). [Video]. YouTube. https://www.youtube.com/watch?v=E1xqSZy9_4I
Taryn Simon – Assembled Audience. (n.d.). Taryn Simon. Retrieved 3 March 2021, from http://tarynsimon.com/works/assembled_audience/#1
The All Infrared Line • Femke Herregraven. (n.d.). Femke Herregraven. Retrieved 3 March 2021, from http://femkeherregraven.net/the-all-infrared-line/
Thompson, C. (2020, October 15). The Untold Technological Revolution Sweeping Through Rural China. The New York Times. https://www.nytimes.com/2020/10/15/books/review/blockchain-chicken-farm-xiaowei-wang.html
TUNING INTERFERENCE: DARK MATTER RADIO exhibit at INVISIBLE. (2020, November 9). [Video]. YouTube. https://www.youtube.com/watch?v=SyIaYMvKYX0
Visnjic, V. A. P. B. F. (2020, October 27). Pump and Surf – Exchanging physical energy for digital information – CreativeApplications.Net. Creative Applications. https://www.creativeapplications.net/environment/pump-and-surf-exchanging-physical-energy-for-digital-information/
What 5 ASIC miners sound like in a normal house. (2019, July 17). [Video]. YouTube. https://www.youtube.com/watch?v=w4KGewMcoME