premise
Using computer vision technology and drones, a system was developed to automate standing stock surveys of plastic waste.
synopsis
I investigated an alternative method for surveying standing stock of plastic litter on beaches. Traditionally, surveyors walk methodically around beach sections, manually recording all plastic litter encountered (Opfer et al., 2012). In comparison, I propose here to use drones equipped with cameras to rapidly survey large areas and to detect and count plastic waste (more specifically plastic bottles) using object detection. I investigate the technological aspect and usability of such a system by iterating through three prototypes. By simplifying the drone piloting process, this project demonstrates that conducting standing stock surveys of plastic waste can potentially be conducted by using a simple and quick process.
Substantiation
In 2016, an estimated 11% of worldwide plastic production, or 19 to 23 million metric tons, infiltrated aquatic ecosystems (Borrelle et al., 2020). Marine plastic contamination has a slew of adverse effects. It poses a physical, biological, and chemical threat to coastal ecosystems (Coe & Rogers, 2011; Derraik, 2002; Gall & Thompson, 2015; Sheavly & Register, 2007). Marine life becomes entangled, suffocates, or dies as a direct result of contact with plastic waste (Thushari & Senevirathna, 2020). Plastic pollution is a global problem, as it has been discovered in even some of the world’s most remote coastal areas, like as example pristine South Pacific islands (Lavers & Bond, 2017). In the long run, this problem will almost certainly be resolved through integrated local, national, and international laws and policies. However, in order to implement them, a thorough understanding of the scope of the problem is required (Maximenko et al., 2019).
However, the global amount of plastic litter on beaches and in coastal waters is unclear at the moment (Onink et al., 2021). This is due to observations of the composition and distribution of plastic litter along shorelines being extremely scarce and imprecise (Maximenko et al., 2019). Because of the prohibitively high cost and logistical impracticality of observing this vast space (Lauro et al., 2014). This is why I wanted to explore an alternative method to the traditional standing stock surveys of beach plastic litter. Traditionally, surveyors walk methodically around sections of beaches, manually recording all plastic litter encountered (Opfer et al., 2012). This approach has the disadvantage of being extremely time-consuming and restricting the types of shorelines that can be surveyed. By utilizing low-altitude aerial photographs, it could be possible to survey larger areas rapidly, especially when combined with computer vision technology. To start, I will focus on plastic bottles, as they are estimated to account for 13% of waste on worldwide shorelines ( Morales-Caselles et al., 2021).
Prototype 1
Comparable systems inspired my first prototype of a system for detecting and counting plastic bottles in a defined area. This was required to resolve the counting of plastic bottles issue. Because the drone could fly over the same object several times tracking objects on video was ruled out. That is why I chose a different technique used in similar projects (C. Martin et al, 2018; Gonçalves et al., 2020; Moy et al, 2018; Fallati et al, 2019). They made an orthomosaic of the whole area. Orthomosaics are composite photographs of a geographic area. They are made by stitching together all of the area’s photos. According to research, the ideal flight height for optimal flight time, terrain coverage, and image resolution was 10 meters (C. Martin et al., 2018; Fallati et al., 2019; Liao & Juang, 2022).
As a first experiment, I asked a user to photograph the entire area that needed to be surveyed using a drone. They accomplished this by utilizing the drone’s official pilot software (DJI Fly). They manually piloted the drone over the entire area, capturing high-resolution images every two seconds and attempting to cover the entire area. These images were then imported into specialized software (Open Drone Map) to create an orthomosaic of the surveyed area.
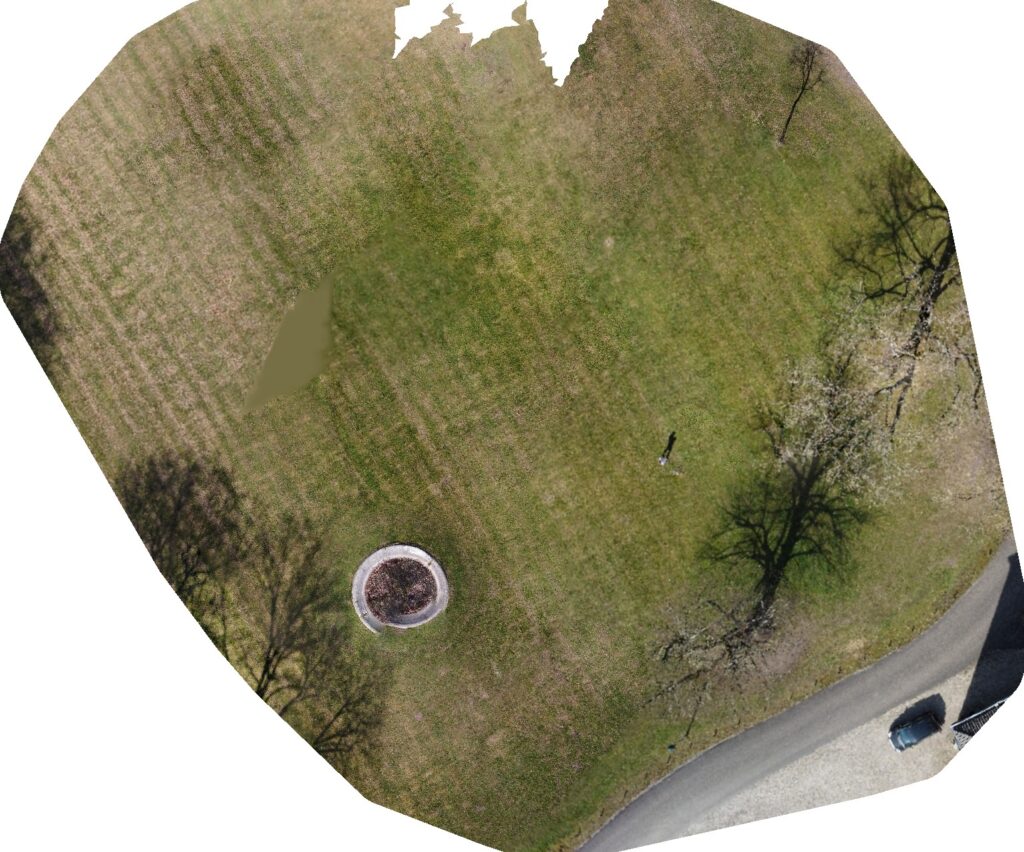
This experiment was enlightening, as it raised numerous issues. To begin, the user had some prior experience flying drones, but it was limited. This resulted in them encountering difficulties while piloting. Specifically, due to the nature of the survey, the drone camera was pointed directly down at the ground, making it difficult for the user to estimate the drone’s position and orientation while flying. Additionally, they were incapable of manually maintaining a constant speed in order to evenly distribute the area covered by the photographs. Furthermore, because the images were taken on a timer and the drone was not stopped to take them, there was some motion blur in the images. All of these factors had a significant impact on the quality of the orthomosaic generated, making it impossible to discern the plastic bottles in the image.
As a result, the computer vision component of this prototype was evaluated using source images rather than the orthomosaic. I used a trained model from PlasticNet to detect plastic waste on beaches for this first prototype. This model was downloaded and implemented in a few lines of code. It was capable of accurately detecting plastic bottles in test images. However, it was unable to detect plastic bottles in drone-captured images due to the instances being too small and the model being trained on images closer to the object (making the object bigger in the picture). Additionally, I learned from this iteration that object detection models perform best when applied to images with the same dimensions as the training data.
Prototype 2
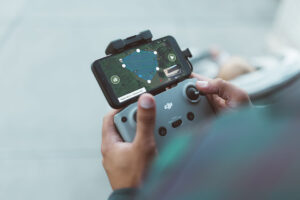
To address the issues raised by the first experiment, the second experiment utilized automated flight to photograph the area. This was accomplished by replacing the official pilot software (DJI fly) in favor of Rainbow, as this pilot software allowed for the creation of automatic flight patterns for mapping areas. The user could mark the area on a map and then launch the drone. The software automatically takes photographs with a default overlap of 80% on either side. This resulted in approximately ten times the number of photographs taken in the first experiment, and with a flight time of half an hour, a battery swap was required during the survey. The experiment had to be repeated twice because the user had accidentally set a timer for photographing in addition to the automatic photographing by the software. As a result, the data became incoherent.
The creation of a high-definition orthomosaic failed, as, after multiple restarts and hours of processing, the conclusion was that my computer lacked sufficient RAM to complete the task. Due to the high computational cost associated with creating such high-definition orthomsaics, I determined that this was not a viable method of achieving the prototype’s goal. Orthomosaics with a lower resolution did not show the plastic bottles in the area. Even though the software claimed that each pixel represented 0.3cm in reality, a single red pixel was used to represent a can of Coca-Cola in the area.
To train a custom object detection model capable of detecting small plastic bottles in images, I chose to train a custom object detection model. I accomplished this by using Roboflow to label plastic bottles in a public dataset, uavvaste. Following that, I used their no-code interface to train a model. This produced promising results, as it detected some plastic bottles in the images taken during the experiments and had an mAP of 77%.
Prototype 3
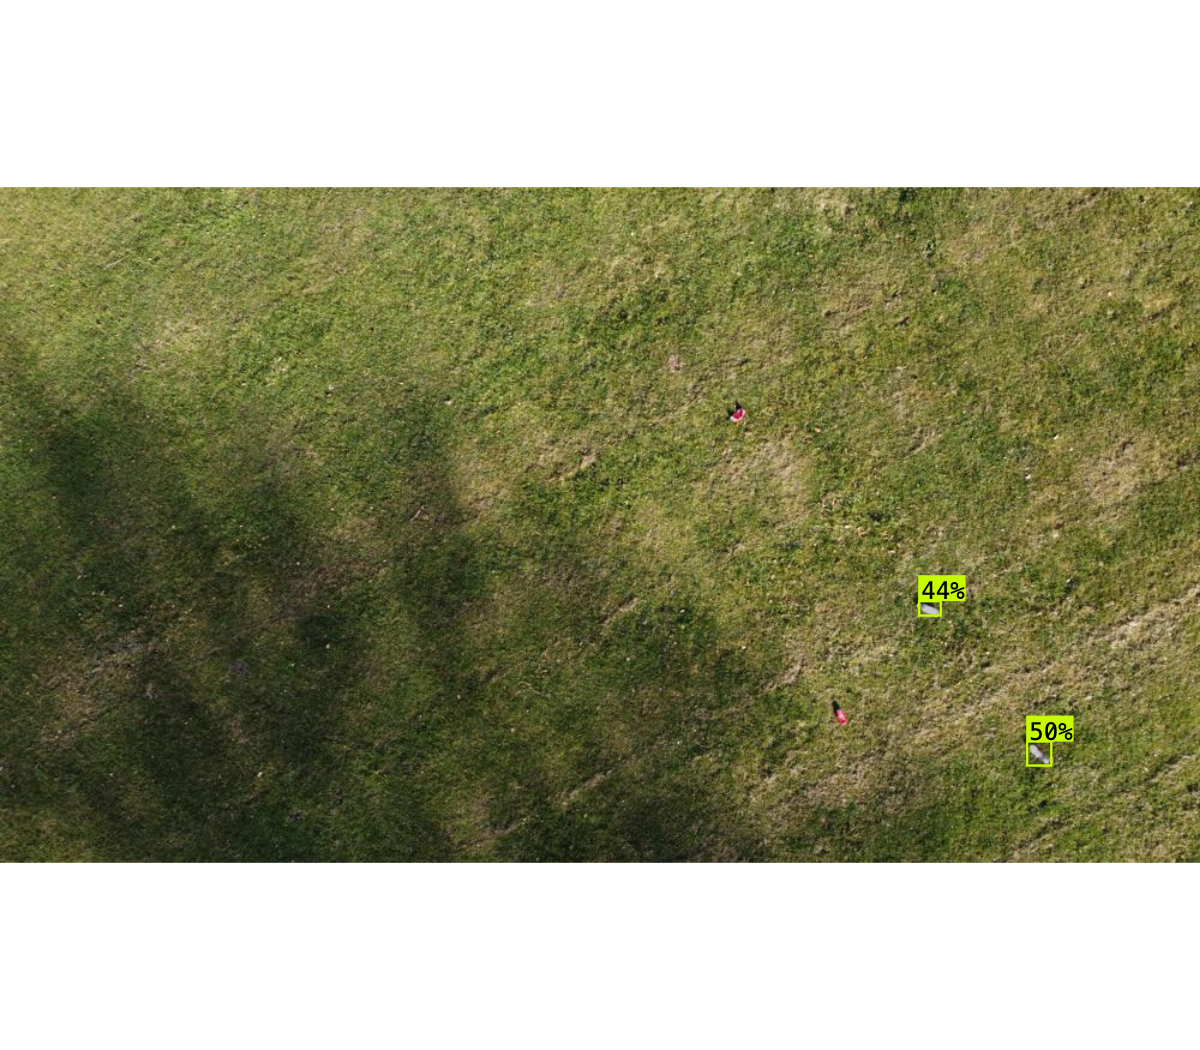
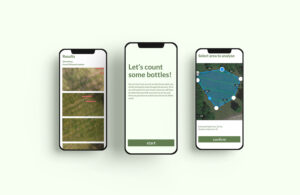
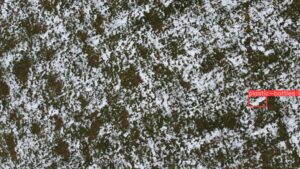
As an alternative to orthomosaics, I considered employing the same principle of automated flight mapping, but with a low overlap (10% ). The images are then cropped by 5% on all sides during processing to avoid detecting duplicates of the same plastic bottle. This ensures that the entire area is photographed but that no images overlap. Calculating the number of plastic bottles is as simple as adding up all the detections. I created an interface to launch plastic detection surveys for the third experiment. This is to ensure that, by restricting the user’s options, fewer errors are made while surveying the area. Additionally, this enables the user to receive the survey’s results minutes after the drone lands. The interface is clickable and can be viewed here. Two ‘wizard of oz’ user tests were conducted to evaluate this interface. Users interacted with the clickable prototype while I performed the tasks on the Rainbow software. The end result was a collection of images and screenshots from previous experiments. While users had no difficulty completing the survey, they did make suggestions for additional features.
I decided to train a YOLOv5 model on the same data to improve the object detection model. I used transfer learning because the amount of data was insufficient to train an accurate model from scratch. I used a model trained on a general dataset as a starting point for training (COCO). With a mAP of 88.8 percent, this model significantly outperformed the Roboflow trained model. However, the snow in the experiment’s photographs results in a few false positives and less detections.

Further research
This project demonstrated that combining object detection and low-altitude aerial photographs is a viable alternative to conventional standing stock surveys. However, there is considerable room for improvement. The object detection model would benefit from a larger more diversified data set. This could be accomplished by utilizing crowdsourcing techniques to label new data as it comes in during the course of conducting the surveys. Additionally, some active learning techniques could be used. Furthermore, this would make it viable to detect other types of plastic waste besides bottles.
Sources
Borrelle, S. B., Ringma, J., Law, K. L., Monnahan, C. C., Lebreton, L., McGivern, A., Murphy, E., Jambeck, J., Leonard, G. H., Hilleary, M. A., Eriksen, M., Possingham, H. P., de Frond, H., Gerber, L. R., Polidoro, B., Tahir, A., Bernard, M., Mallos, N., Barnes, M., & Rochman, C. M. (2020). Predicted growth in plastic waste exceeds efforts to mitigate plastic pollution. Science, 369(6510), 1515–1518. https://doi.org/10.1126/science.aba3656
Coe, J. M., & Rogers, D. (Eds.). (2011). Marine Debris: Sources, Impacts, and Solutions (Springer Series on Environmental Management) (reprint of the original 1st ed. 1997 ed.). Springer Science & Business Media.
Derraik, J. G. (2002). The pollution of the marine environment by plastic debris: a review. Marine Pollution Bulletin, 44(9), 842–852. https://doi.org/10.1016/s0025-326x(02)00220-5
Fallati, L., Polidori, A., Salvatore, C., Saponari, L., Savini, A., & Galli, P. (2019). Anthropogenic Marine Debris assessment with Unmanned Aerial Vehicle imagery and deep learning: A case study along the beaches of the Republic of Maldives. Science of The Total Environment, 693, 133581. https://doi.org/10.1016/j.scitotenv.2019.133581
Gall, S., & Thompson, R. (2015). The impact of debris on marine life. Marine Pollution Bulletin, 92(1–2), 170–179. https://doi.org/10.1016/j.marpolbul.2014.12.041
Lauro, F. M., Senstius, S. J., Cullen, J., Neches, R., Jensen, R. M., Brown, M. V., Darling, A. E., Givskov, M., McDougald, D., Hoeke, R., Ostrowski, M., Philip, G. K., Paulsen, I. T., & Grzymski, J. J. (2014). The Common Oceanographer: Crowdsourcing the Collection of Oceanographic Data. PLoS Biology, 12(9), e1001947. https://doi.org/10.1371/journal.pbio.1001947
Lavers, J. L., & Bond, A. L. (2017). Exceptional and rapid accumulation of anthropogenic debris on one of the world’s most remote and pristine islands. Proceedings of the National Academy of Sciences, 114(23), 6052–6055. https://doi.org/10.1073/pnas.1619818114
Liao, Y. H., & Juang, J. G. (2022). Real-Time UAV Trash Monitoring System. Applied Sciences, 12(4), 1838. https://doi.org/10.3390/app12041838
Martin, C., Parkes, S., Zhang, Q., Zhang, X., McCabe, M. F., & Duarte, C. M. (2018). Use of unmanned aerial vehicles for efficient beach litter monitoring. Marine Pollution Bulletin, 131, 662–673. https://doi.org/10.1016/j.marpolbul.2018.04.045
Maximenko, N., Corradi, P., Law, K. L., van Sebille, E., Garaba, S. P., Lampitt, R. S., Galgani, F., Martinez-Vicente, V., Goddijn-Murphy, L., Veiga, J. M., Thompson, R. C., Maes, C., Moller, D., Löscher, C. R., Addamo, A. M., Lamson, M. R., Centurioni, L. R., Posth, N. R., Lumpkin, R., . . . Wilcox, C. (2019). Toward the Integrated Marine Debris Observing System. Frontiers in Marine Science, 6. https://doi.org/10.3389/fmars.2019.00447
Morales-Caselles, C., Viejo, J., Martí, E., González-Fernández, D., Pragnell-Raasch, H., González-Gordillo, J. I., Montero, E., Arroyo, G. M., Hanke, G., Salvo, V. S., Basurko, O. C., Mallos, N., Lebreton, L., Echevarría, F., van Emmerik, T., Duarte, C. M., Gálvez, J. A., van Sebille, E., Galgani, F., . . . Cózar, A. (2021). An inshore–offshore sorting system revealed from global classification of ocean litter. Nature Sustainability, 4(6), 484–493. https://doi.org/10.1038/s41893-021-00720-8
Onink, V., Jongedijk, C. E., Hoffman, M. J., van Sebille, E., & Laufkötter, C. (2021). Global simulations of marine plastic transport show plastic trapping in coastal zones. Environmental Research Letters, 16(6), 064053. https://doi.org/10.1088/1748-9326/abecbd
Opfer, S., Arthur, C., & Lippiat, S. (2012). NOAA marine debris shoreline survey field guide. NOAA.
Sheavly, S. B., & Register, K. M. (2007). Marine Debris & Plastics: Environmental Concerns, Sources, Impacts and Solutions. Journal of Polymers and the Environment, 15(4), 301–305. https://doi.org/10.1007/s10924-007-0074-3
Thushari, G., & Senevirathna, J. (2020). Plastic pollution in the marine environment. Heliyon, 6(8), e04709. https://doi.org/10.1016/j.heliyon.2020.e04709