Premise
Using computer vision to scan the barcodes of groceries, users find the carbon footprint of products and get recommendations for products with lower CO2 emissions.
Synopsis
People should be more and more educated and informed about their own carbon footprint emissions. The actions we do every day negatively affect the environment. One of the measures we can take is to purchase products that have low carbon footprint, however there are little resources which could indicate the emissions values in order for us to actually purchase such products. In order to aid citizens in seeing the carbon footprint value of groceries and to provide alternative product recommendations, I decided to create this tool where users can scan the barcode of a product and find information on it.
Scope of the research. Literature insights.
Climate change is one of the environmental challenges that humanity is facing. Greenhouse emission gases (GHG) are contributing to climate change and they are partly generated by people’s actions: travelling, food consumption, energy used in households, daily life activities (González-García et al., 2018). Carbon footprint is the metric used to measure environmental impact. The supply chain of agri-food system (industrial processes, packaging, retail, transport, consumption, fuel production, and waste management) contributes to 29& of the GHG (Crippa et al., 2021).
The international treaty on climate change, also known as the Paris Agreement, has set a goal to maintain the temperature rise below 1.5 °C (UKCOP26, 2021) and in order to achieve this goal, according to Petersen, Petersen & Ahcin, 2020, people should start purchasing products that have lower carbon emissions. This way individuals’ carbon footprint values could decrease significantly. Moreover, the demand for products and groceries that produce high CO2 emissions is high. The supply has to match that demand, which leads to increase in the carbon footprint of individuals (IPPC, 2022; Koroneos et al., 2005).
Raising awareness of the severity and significant impact of the CO2 emissions is an ongoing process (Capstick et al., 2014; Petersen, Petersen & Ahcin, 2020) and, according to Groening, Inman and Ross Jr (2015), people feel more accountable for the products they buy as they are more aware of the manufacturing process and the supply chain as a whole. Moreover, previous studies have shown that people are interested in purchasing more sustainable products and see the need of having applications that can aid them in choosing the products with lower emissions (Fosgaard, Pizzo & Sadoff, 2021).
It has been shown that individuals cannot accurately estimate how much CO2 they emit and tend to underestimate the values (Grinstein et al., 2018). Technological solutions for sustainability related issues are quick and can aid one in reducing one’s emissions. Moreover, individuals are open to using such tools especially if they receive real-time feedback and information (Joerß, Hoffmann, Mai & Akbar, 2021). Currently there are no applications that can give information of the carbon footprint values on the spot. The existing applications give carbon footprint information upon searching for a certain product, such as meat, cheese, fruit, etc., but they do not give the exact CO2 value of the product. Moreover, there are no applications that recommend other groceries with a lower carbon footprint. This project aims to find improvements to an already existing prototype. The prototype is at a very preliminary state, including both the recommender system and the design. Moreover, the barcode scanner works from the laptop camera, users cannot test the prototype in a real supermarket and test whether they would actually like what recommendations they receive. I have continued testing and improving the prototype as per the latest feedback received.
First iteration
Due to the gap in research regarding solutions that bring product information to the end users on the spot, using a barcode scanner is a potentially easy solution with which users can find information about a product quickly. Based on a previous study, consumers find it easy to scan a product and monitor their progress by registering the scanned items (Maringer et al., 2018). Based on this, a barcode scanner seems a good solution to scan and receive information on a product (Byrd-Bredbenner & Bredbenner, 2010). Barcode readers can be coded in Python with a build-in library called Pyzbar. This library uses computer vision, a field within artificial intelligence, and more specifically, deep learning through which the barcodes are comprehended and decoded with the help of algorithms (Wudhikarn, Charoenkwan & Malang, 2022).
The dataset I used for this project contains dairy products. I asked 5 users to answer a few questions including what diet they have. For the purpose of this project, I have decided to implement the prototype on cheese and dairy products because most of the users have vegetarian diets. I have web scraped the Albert Heijn website and have added the CO2 values for each product. The CO2 value dataset was collected from peer-reviewed articles and grey literature with 3349 carbon footprint values (Petersson et al., 2021). Once scanned and decoded, the barcode of the product is connected to an Albert Heijn API from which the title of the product is taken and then connected to my dataset from which further filters are applied.
One major improvement which all the previous users have mentioned is being able to filter the recommendations more. For instance, if the user scans a hard cheese product, they would like to receive a recommendation of a hard cheese.
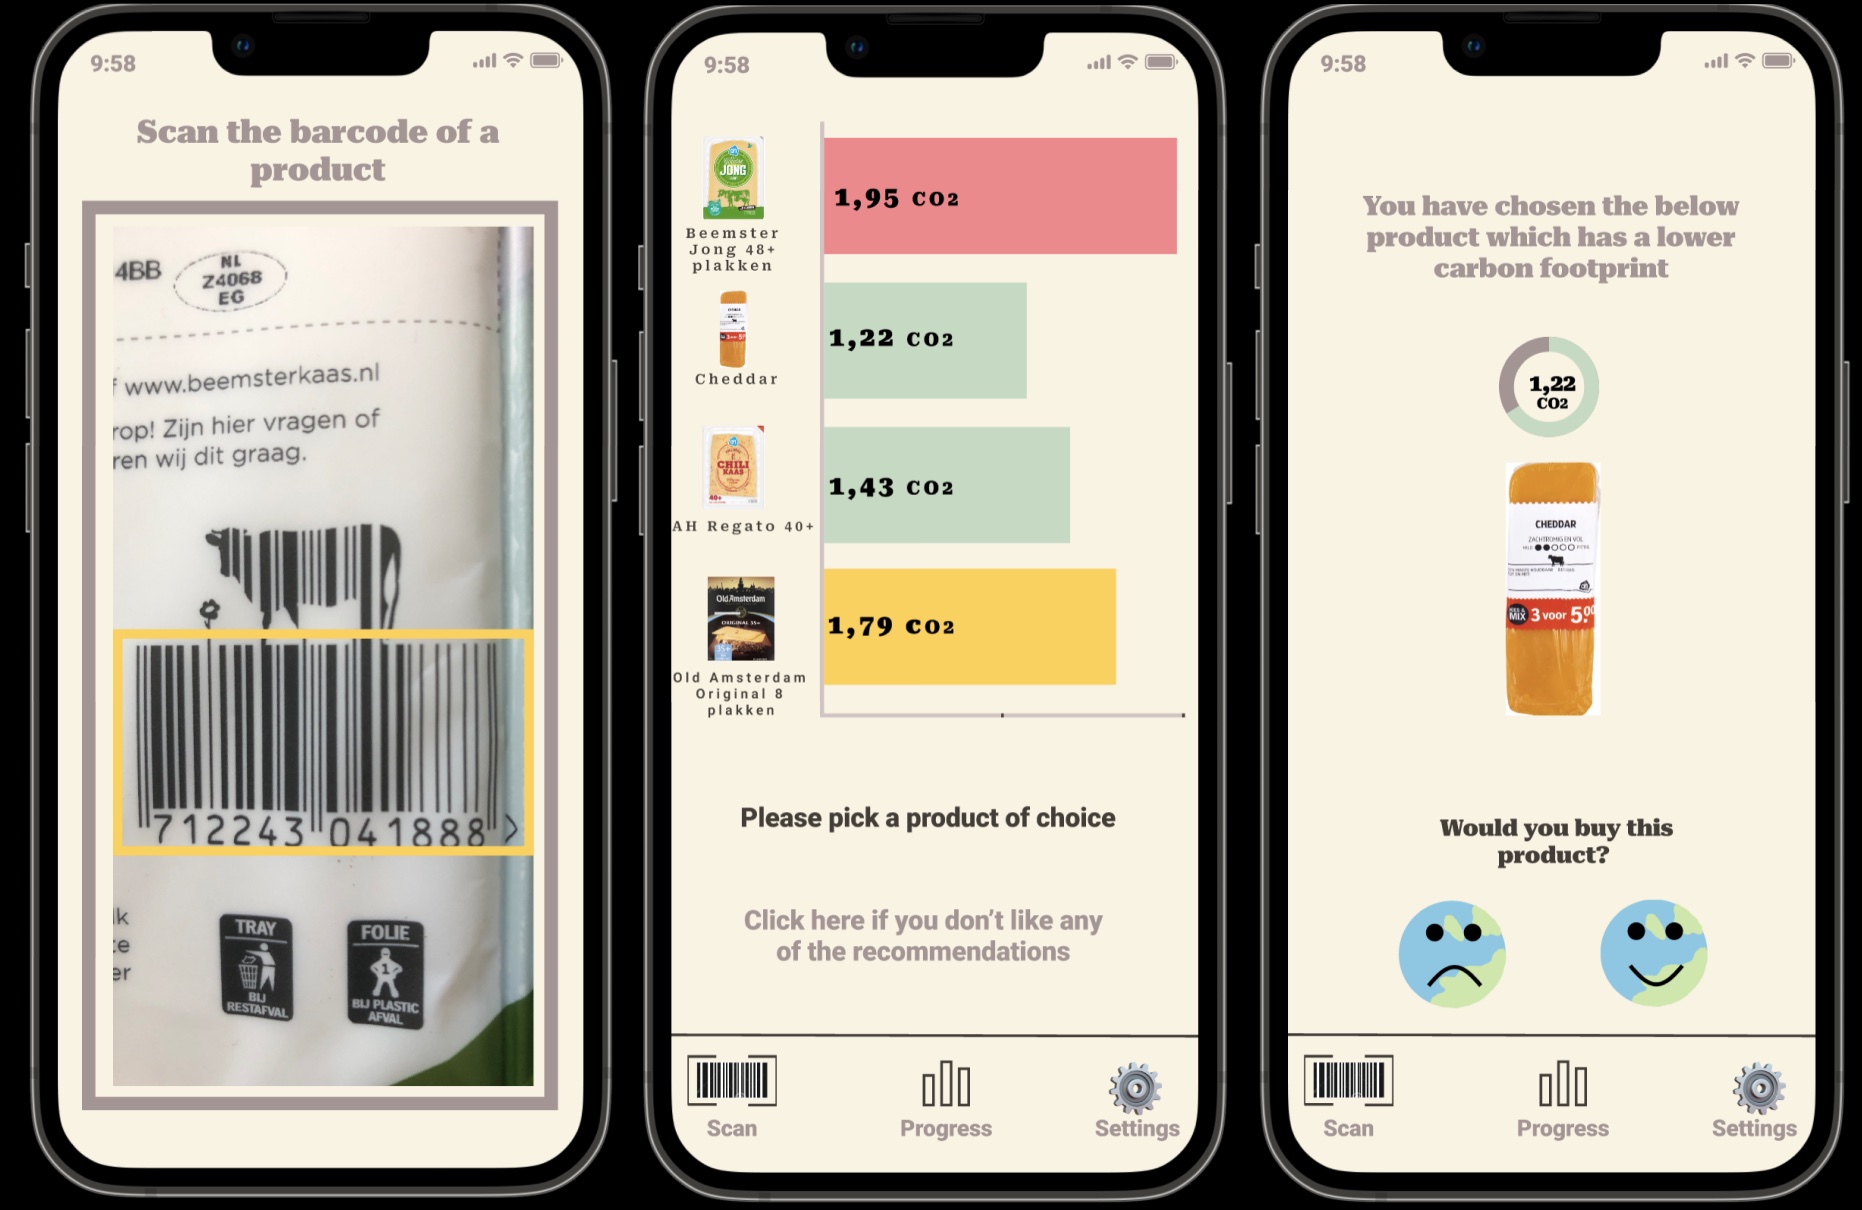
Figure 1. Recommendation improvements
Usability testing was used to test the prototype with users where they were given tasks to complete and then asked questions about the prototype. The insights I have received following the first round of testing are mostly regarding the design on the app. The first iteration consisted of improving the recommender system by adding more filters.
- Users liked they received recommendations of the same type of product
- More personalised filtering can make the recommendations better (users would like to be able to choose different filtering)
- Diet and allergies page does not have the greatest design
- The sign-up and first pages need improvement
Next iteration included design improvements.
Second iteration
The improved prototype was tested by users though another usability testing method where they were given tasks.
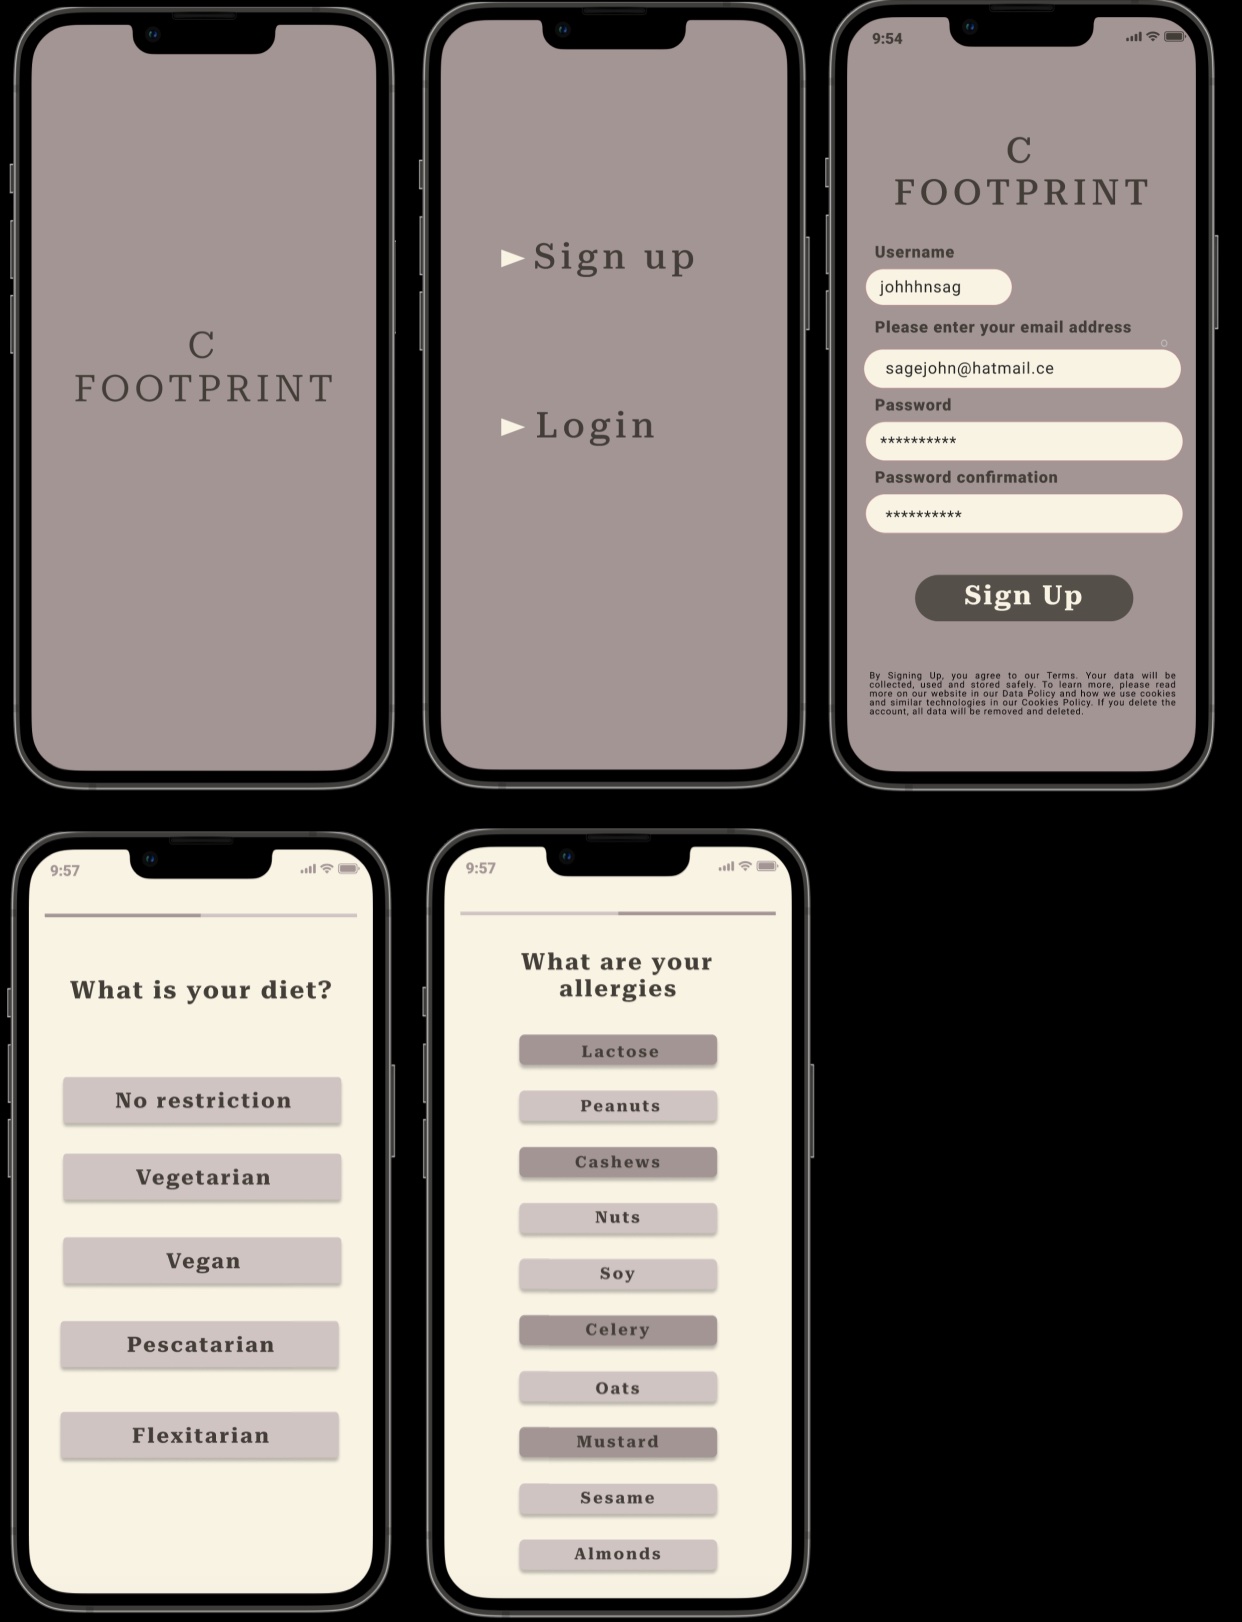
Figure 2. Sign-up and restriction pages were improved as per users feedback
The most important insights from this iteration were
- Users thought the recommendations they receive are better, they match more the product they initially scan
- The overall design was better but still there it needed improvement
- Users showed interest in the value of the carbon footprint they saved by purchasing the recommended products and what it is equivalent to in terms of kilometres driven, or energy consumption
The last insight has been implemented in the next iteration.
Third iteration
Users are interested in seeing the amount of CO2 saved after choosing the recommended products and what that value is an equivalent to.
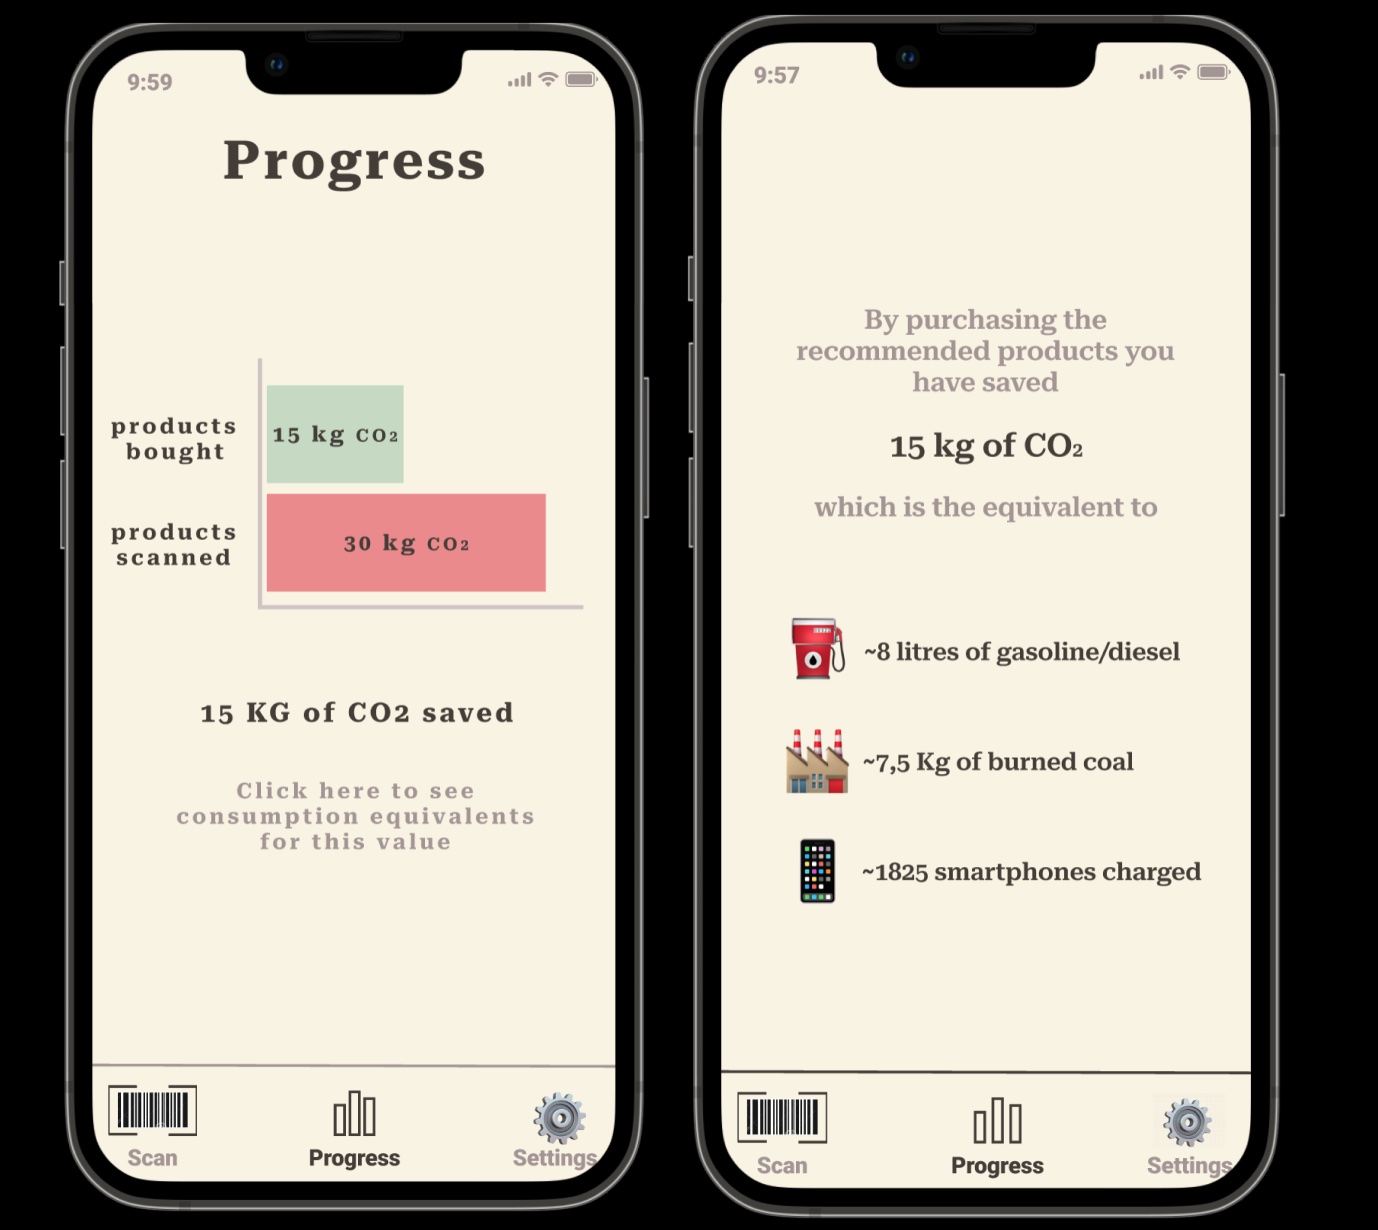
Figure 3. CO2 equivalent page
Conclusion and future research
The prototype has a great potential to be used, especially by younger people that are more aware and more willing to use such a tool. If users notice their CO2 emissions value decreases even more by choosing for instance fresh cheese instead of hard cheese, they could be influenced in purchasing the products with the lowest CO2 value. Users have mentioned that they would like to know more about the brand itself and to be able to filter the results based on brands as well. Future research could focus on how to make more filters and to add more more information of products in order to give better suited recommendations.
References
Byrd‐Bredbenner, C., & Bredbenner, C. A. (2010). Assessing the home food environment nutrient supply using mobile barcode (Universal Product Code) scanning technology. Nutrition & Food Science, 40(3), 305–313. https://doi.org/10.1108/00346651011044005
Capstick, S., Whitmarsh, L., Poortinga, W., Pidgeon, N., & Upham, P. (2014). International trends in public perceptions of climate change over the past quarter century. WIREs Climate Change, 6(1), 35–61. https://doi.org/10.1002/wcc.321
Crippa, M., Solazzo, E., Guizzardi, D., Monforti-Ferrario, F., Tubiello, F. N., & Leip, A. (2021). Food systems are responsible for a third of global anthropogenic GHG emissions. Nature Food, 2(3), 198–209. https://doi.org/10.1038/s43016-021-00225-9
Fosgaard, T. R., Pizzo, A., & Sadoff, S. (2021). Do people respond to the climate impact of their behavior? The effect of carbon footprint information on grocery purchases (No. 2021/05). IFRO Working Paper.
González-García, S., Esteve-Llorens, X., Moreira, M. T., & Feijoo, G. (2018). Carbon footprint and nutritional quality of different human dietary choices. Science of The Total Environment, 644, 77–94. https://doi.org/10.1016/j.scitotenv.2018.06.339
Grinstein, A., Kodra, E., Chen, S., Sheldon, S., & Zik, O. (2018). Carbon innumeracy. PLOS ONE, 13(5), e0196282. https://doi.org/10.1371/journal.pone.0196282
Groening, C., Inman, J. J., & Ross Jr., W. T. (2015). The role of carbon emissions in consumer purchase decisions. International Journal of Environmental Policy and Decision Making, 1(4), 261. https://doi.org/10.1504/ijepdm.2015.074719
IPPC. (2022, February 28). Report climate change 2022 key findings. Climate Neutral Group. Retrieved February 28, 2022, from https://www.climateneutralgroup.com/en/news/report-climate-change-2022-key-findings/
Joerß, T., Hoffmann, S., Mai, R., & Akbar, P. (2021). Digitalization as solution to environmental problems? When users rely on augmented reality-recommendation agents. Journal of Business Research, 128, 510–523. https://doi.org/10.1016/j.jbusres.2021.02.019
Koroneos, C., Roumbas, G., Gabari, Z., Papagiannidou, E., & Moussiopoulos, N. (2005). Life cycle assessment of beer production in Greece. Journal of Cleaner Production, 13(4), 433–439. https://doi.org/10.1016/j.jclepro.2003.09.010
Maringer, M., Wisse-Voorwinden, N., Veer, P. V. T., & Geelen, A. (2018). Food identification by barcode scanning in the Netherlands: a quality assessment of labelled food product databases underlying popular nutrition applications. Public Health Nutrition, 1–8. https://doi.org/10.1017/s136898001800157x
Petersen, S. A., Petersen, I., & Ahcin, P. (2020). Smiling Earth—Raising Awareness among Citizens for Behaviour Change to Reduce Carbon Footprint. Energies, 13(22), 5932. https://doi.org/10.3390/en13225932
Petersson, T., Secondi, L., Magnani, A., Antonelli, M., Dembska, K., & Valentini, R. (2021): SU-EATABLE LIFE: a comprehensive database of carbon and water footprints of food commodities. figshare. Dataset. https://doi.org/10.6084/m9.figshare.13271111.v1
Wudhikarn, R., Charoenkwan, P., & Malang, K. (2022). Deep Learning in Barcode Recognition: A Systematic Literature Review. IEEE Access, 10, 8049–8072. https://doi.org/10.1109/access.2022.3143033