Premise
Developing a BCI/EEG-based prototype to increase awareness of stress patterns in higher education students during the exam/graduation period.
Synopsis
This research project aims to develop a prototype Brain-Computer Interface (BCI) to help higher education students cope with stress and procrastination during exam time. Using the Emotiv Epoc+, which provides real-time metrics, the project went through three iterative phases, refining the prototype based on evaluations and feedback. The final iteration provided a simplified user interface displaying critical metrics and real-time notifications. While the prototype has been shown to increase stress awareness and encourage needed breaks, the comfort of the chosen BCI headset needs to be improved for long-term testing. Future research could explore alternative, more comfortable headsets, stress-reducing interventions, and the long-term impact of such applications on mental health and academic success.
Substantiation
Stress is a common problem in higher education that can significantly affect academic performance, mental health, and general well-being (Alaya et al., 2021; Barbayannis et al., 2022; Pascoe et al., 2020; Voge, 2007). Stress can have different causes and vary from person to person (Alotaibi et al., 2020; Ameena, 2021; Saleh et al., 2017). In addition, the causes of stress can also be symptoms of, or facilitated by, stress, making it challenging to identify and manage the causes effectively. There are self-help methods and apps for stress management (Drissi et al., 2020), but their effectiveness depends mainly on the individual causes of stress and the self-awareness to use them in the first place.
This research project explores the potential of Brain-Computer Interface (BCI) technology to help higher education students manage stress by revealing their stress patterns. By measuring brain activity, BCI technology, such as Emotiv Epoc+, can provide real-time metrics (Emy, 2022) that give students valuable insight into their stress triggers and levels. By identifying these triggers, students can learn to manage their stress better, leading to improved academic performance, mental health, and overall well-being.
This research project focused on developing a prototype using BCI technology in 3 iterative phases, each with self-evaluation and external testing with a fellow student. Each iteration builds on the findings and feedback from the previous phase to refine the prototype and improve its effectiveness in helping monitor and manage the student’s stress.
Iteration 01
Prototype
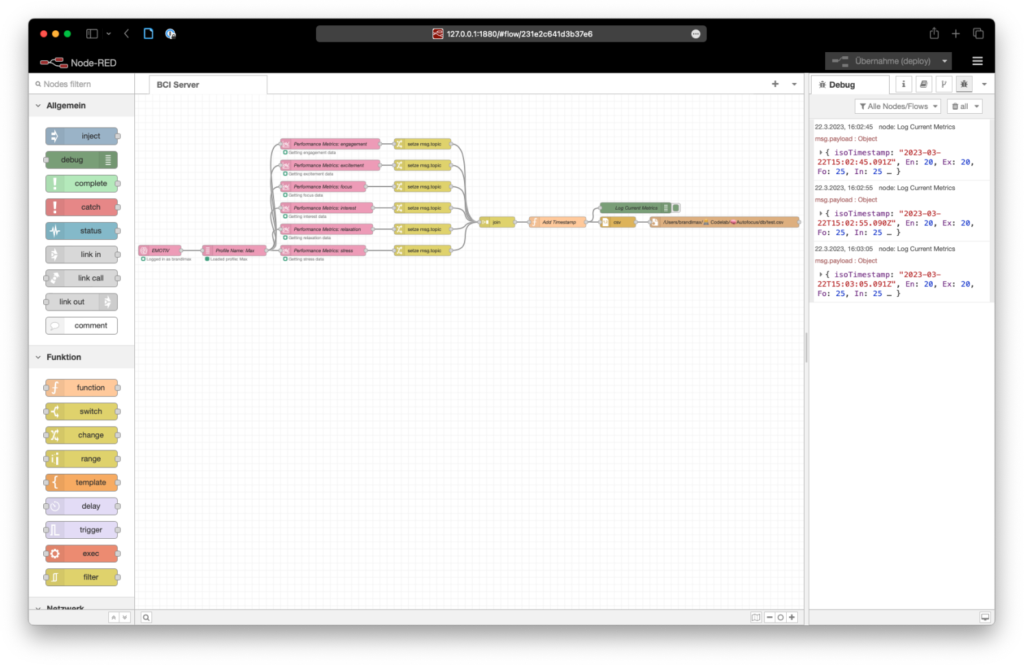
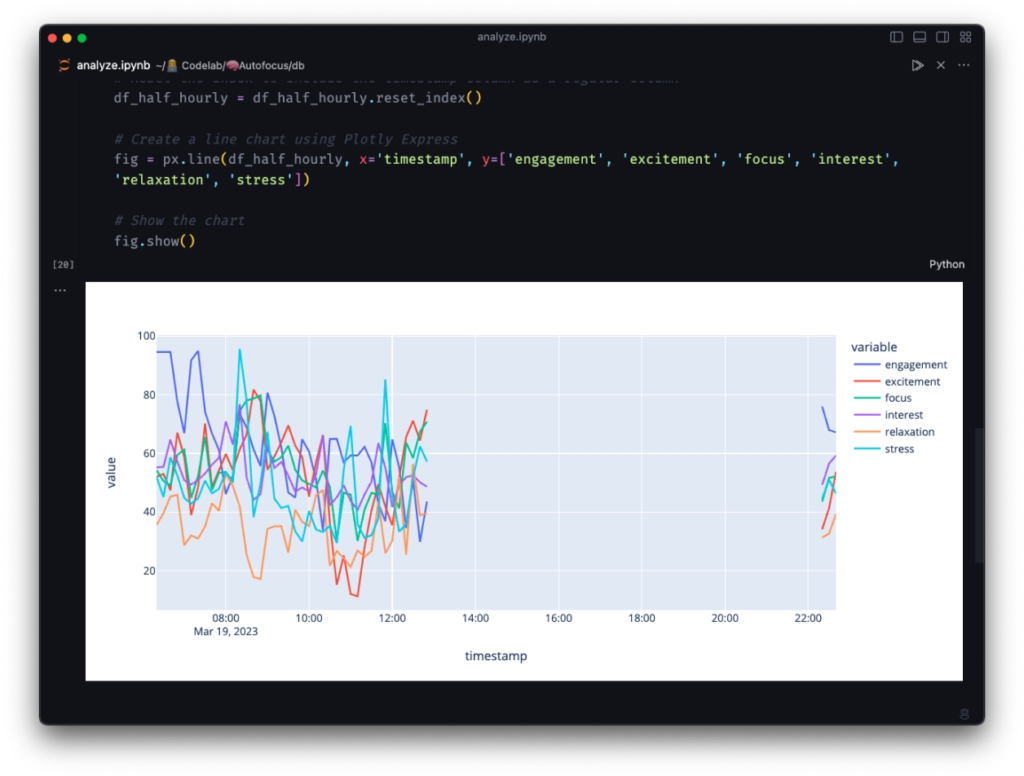
The first iteration focused on setting up the Emotiv Epoc+ Brain-Computer Interface (BCI) system, including installing the necessary software and environment. The Emotiv Performance Metrics API obtained emotional metrics from brain activity. These metrics data were collected and stored via a NodeRED server as CSV files. For manual data analysis of the CSV, a Jupyter notebook was used to visualize the data in graphs. The prototype was then tested by self-evaluation (recording data over multiple hours) and with a fellow female student to gain insights into its effectiveness in monitoring stress and how the Emotiv would work on longer hair. In addition, the real-time monitoring tools provided by Emotiv were tested.

Evaluations
The evaluation of the first iteration revealed that the real-time feedback was exciting and valuable to the student. However, the limitation to a 3-minute overview of the Emotiv provided tool was not sufficient to learn more about the change of metrics of a more extended learning session. The findings from the testing phase also highlighted the discomfort with the headset, the limitations of battery life, and the initial skepticism about the system’s effectiveness. Nonetheless, the student intuitively began to use breathing techniques when an increased stress level was noticed in the live visualization, highlighting the system’s potential to promote self-regulation. The user found the real-time influence of breathing on the readings fascinating. However, it was found that some logging is needed to understand better the context of the measurements over a longer measurement period. The testing showed that the prototype was compatible with short and long hair, although long hair made the measurements unstable and took much longer to set up.
Critical Reflections
Based on the evaluations, it was determined that the user interface and data logging needed to be implemented. Because the existing headset could not be modified, the issues of comfort and battery life were ignored, and the focus was placed on other UI aspects of the system. The next steps included integrating the data logging capabilities for better analysis.
Iteration 02
Prototype
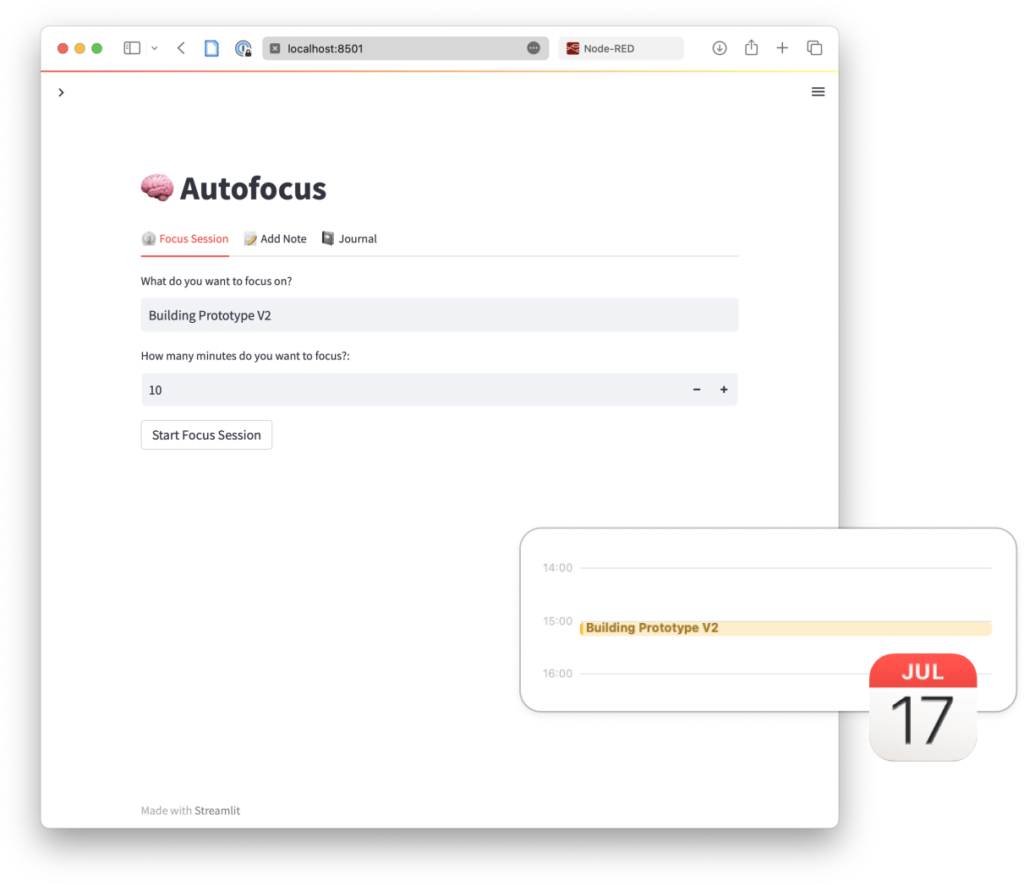
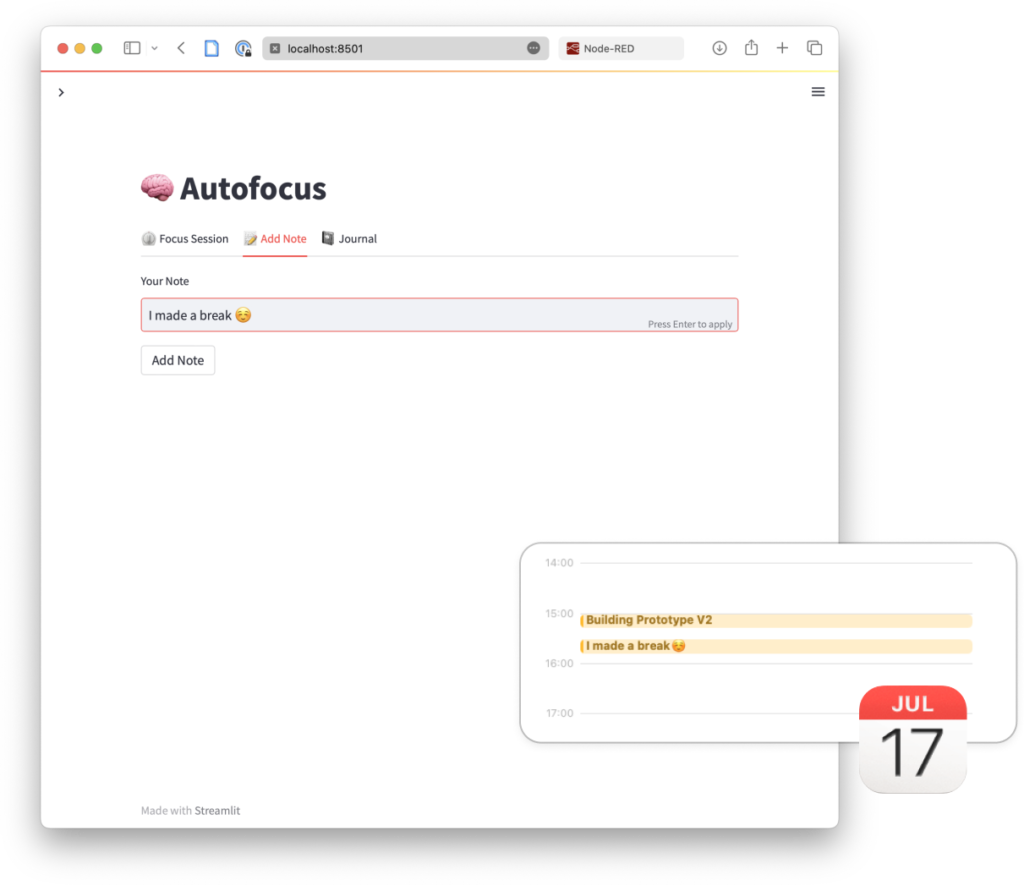
In the second iteration, the focus shifted to developing a more compelling user interface to help students better understand their stress patterns. A Streamlit UI was developed, and the Node-RED server was extended to launch the interface. The new user interface consisted of three modes: “Focus session”-mode, “Add note”-mode, and “Journal”-mode. “Focus session”-mode included a Pomodoro timer that allowed students to track their work and its duration, which was then stored in a calendar app. “Add note”-mode allowed users to log events or feelings, while “Journal”-mode combined log data and calendar data to visualize the impact of various factors on performance metrics.

Evaluations
The student found the user interface overwhelming as too many values were displayed at once, making it difficult to understand the meaning of each metric. It was found that engagement seemed to indicate how much “energy” and motivation one had for a task, as this decreased with the amount of time one worked on a task without a break. Testing also showed that taking a break increased the engagement metric. Beyond that, users needed help to gain insights from the data and determine when to take a break. The tool was also distracting because users had to look at the data actively while trying to focus. The graphs and remembering to document the activities were perceived as too complicated and too much effort.
Critical Reflections
The feedback from the second iteration led to the finding that real-time awareness could be more valuable and effective in managing student stress than analyzing historical data. With a real-time notification in a moment of stress, the user can actively intervene and reflect on what led to the situation. Additionally, a more automated and focused interface is needed, as self-protocol is too much effort for the student. The next iteration should therefore focus on refining the user interface to focus the user’s attention on the most important readings and use it only when needed.
Iteration 03
Prototype
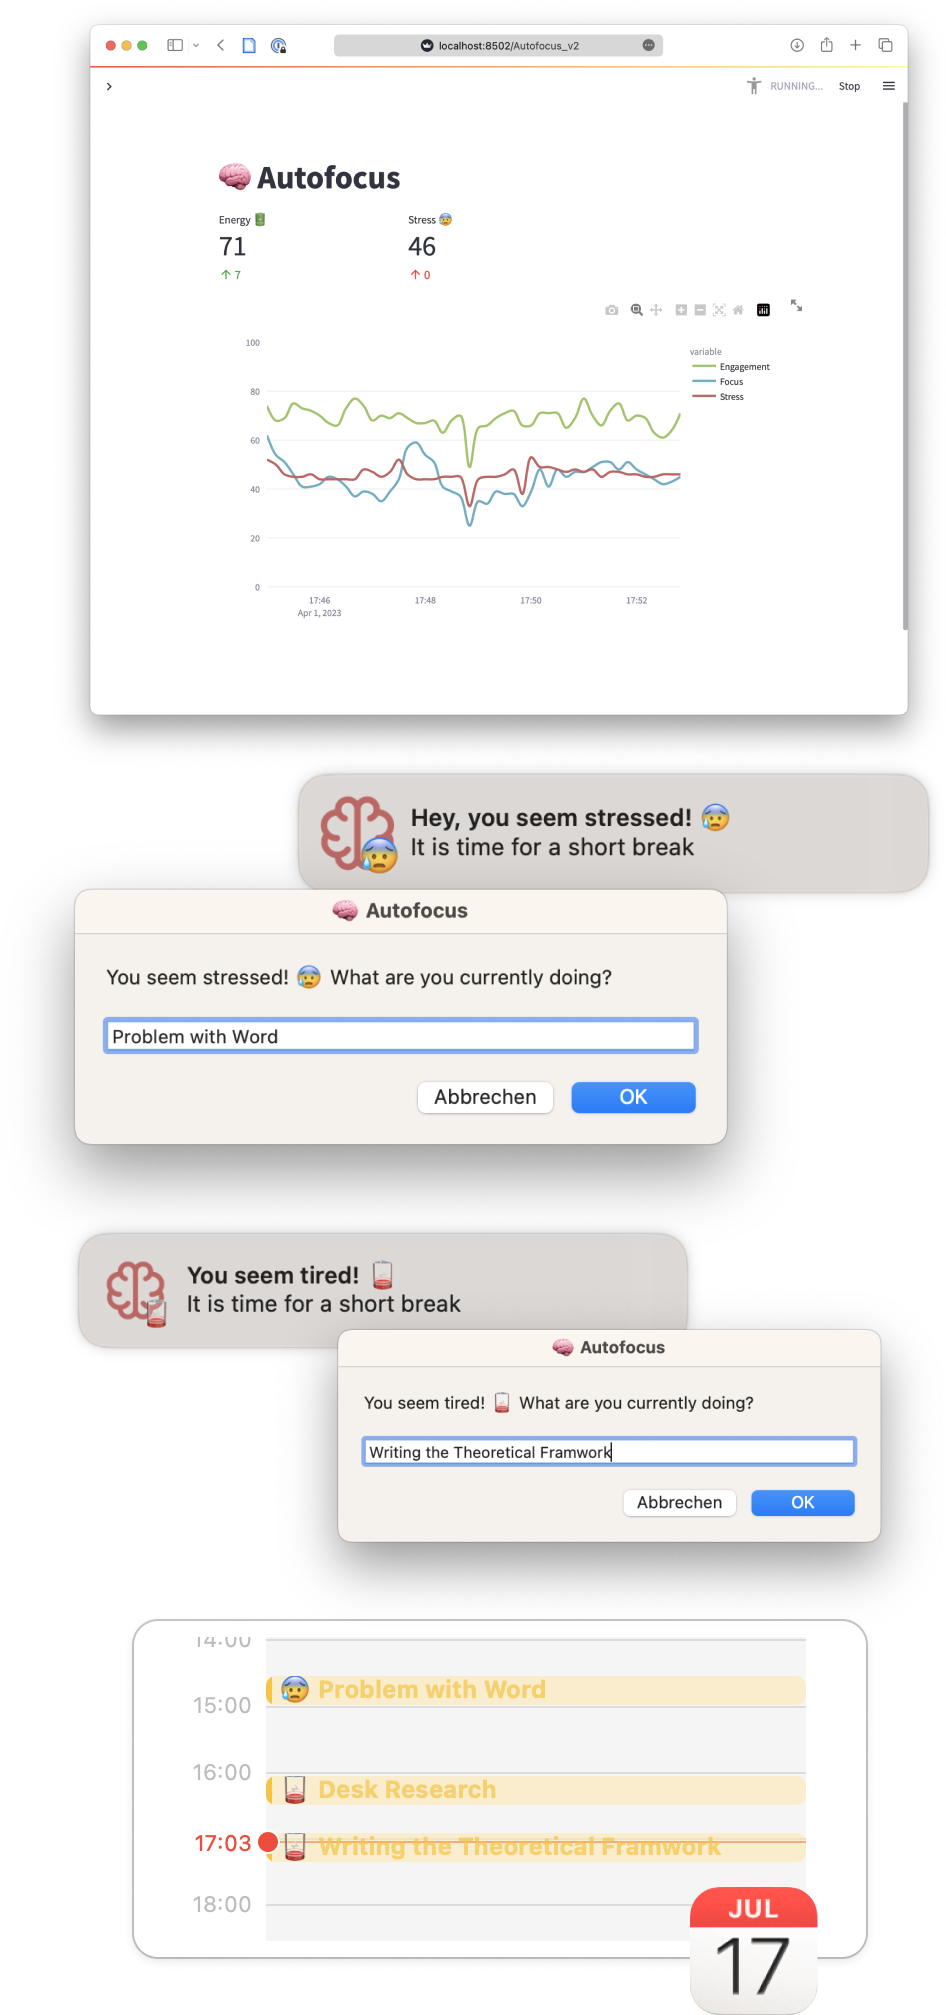
In the third iteration, the user interface was greatly simplified to provide users with only the most essential information they need to understand their stress and energy levels. The user interface was reduced to essential elements and included only the engagement metrics (renamed “energy” for better understanding) and stress. These were prominently displayed, along with a real-time graph that showed only Energy, Focus, and Stress. Automation was introduced for logging and history: When energy or stress reaches a certain threshold, a notification is sent to the user asking them to enter their current activity, which is then logged as a calendar event. The user can see in their calendar an overview of when they were stressed or unengaged during the day and what events caused this.
Evaluations
The simplified user interface led to a better understanding of the stress and energy metric. According to the student and the self-evaluation, real-time notifications effectively raised awareness of stress and engagement patterns. A positive effect was also noted in the self-assessment. The decision to outsource the overview in the calendar was positively received. Combining stress events and other entries gave the user an understandable visualization of which events/thoughts caused stress or when the engagement dropped off. However, the interface required an introduction; due to the reduced interactions, the user was unaware that there were notifications and that nothing else needed to be done manually at the start.
Critical Reflections
While the third iteration showed improvements in the simplicity of the user interface and the user experience through real-time notifications, there are still areas that need further refinement. The next iteration should have an integrated onboarding and test the metrics on a more extensive and diverse student population.
Conclusion
The BCI/EEG-based prototype developed in this research project has shown potential for increasing students’ awareness of their stress patterns and prompting them to take breaks when needed. However, aspects still need further refinement, such as validating the “energy” metric and conducting long-term testing with a more diverse and extensive student population to confirm the tool’s effectiveness. Investigating and using alternative, more comfortable BCI headsets may also be practical. In addition, future research could explore the development of additional stress-reducing interventions based on real-time metrics. Overall, BCI is a promising technology for stress management, especially as devices become more affordable, more comfortable, and usable. It would be interesting to see how such applications and BCI technology can also impact other areas of mental health long term.
References
Alaya, M. B., Ouali, U., Youssef, S. B., Aissa, A., & Nacef, F. (2021). Academic procrastination in university students: Associated factors and impact on academic performance. European Psychiatry, 64(S1), S759–S760. https://doi.org/10.1192/j.eurpsy.2021.2013
Alotaibi, A. D., Alosaimi, F. M., Alajlan, A. A., & Bin Abdulrahman, K. A. (2020). The relationship between sleep quality, stress, and academic performance among medical students. Journal of Family & Community Medicine, 27(1), 23–28. https://doi.org/10.4103/jfcm.JFCM_132_19
Ameena, B. B. (2021). An Overview of Stress Management. Shanlax International Journal of Arts, Science and Humanities, 8(S1-Feb), Article S1-Feb. https://doi.org/10.34293/sijash.v8iS1-Feb.3956
Barbayannis, G., Bandari, M., Zheng, X., Baquerizo, H., Pecor, K. W., & Ming, X. (2022). Academic Stress and Mental Well-Being in College Students: Correlations, Affected Groups, and COVID-19. Frontiers in Psychology, 13. https://www.frontiersin.org/articles/10.3389/fpsyg.2022.886344
Drissi, N., Ouhbi, S., Janati Idrissi, M. A., & Ghogho, M. (2020). An analysis on self-management and treatment-related functionality and characteristics of highly rated anxiety apps. International Journal of Medical Informatics, 141, 104243. https://doi.org/10.1016/j.ijmedinf.2020.104243
Emy. (2022, November 14). What can we measure with EMOTIV hardware and software? EMOTIV. https://www.emotiv.com/knowledge-base/what-can-we-measure-with-emotiv-hardware-and-software/
Pascoe, M. C., Hetrick, S. E., & Parker, A. G. (2020). The impact of stress on students in secondary school and higher education. International Journal of Adolescence and Youth, 25(1), 104–112. https://doi.org/10.1080/02673843.2019.1596823
Saleh, D., Camart, N., & Romo, L. (2017). Predictors of Stress in College Students. Frontiers in Psychology, 8. https://www.frontiersin.org/articles/10.3389/fpsyg.2017.00019
Voge, D. (2007). Classroom Resources for Addressing Procrastination. Research and Teaching in Developmental Education, 23(2), 88–96.
Emotiv Epoc+ headset in title image:
Chrissshe, CC BY-SA 4.0, via Wikimedia Commons