Premise
Discovering digital tools, like APIs, Image Recognition and chatbots, to investigate which tools are the most effective for stimulating healthy food decisions.
Synopsis
Making healthy food decisions can be difficult. People are sometimes not motivated for a healthy lifestyle, or they can be influenced by grocery store (unhealthy) promotions or find it difficult to know whether a product is healthy or not. Making unhealthy food decisions can lead to an unhealthy lifestyle or, when people are having overweight, diseases. To make healthy food decisions easier, digital solutions will be explored and evaluated.
Introduction
In the Netherlands, among 46.7 percent of the people are overweight (RIVM, n.d.). This number has increased with 35 percent compared to 1990 (RIVM, n.d.). Eating too much or unhealthy for a long period of time can lead to overweight or obesity, with possible health consequences in the future (National Institute of Diabetes and Digestive and Kidney Diseases, 2021).
Making unhealthy food decisions can be caused by behavioural factors. People are more interested in the short-term benefits compared to the long-term benefits because the future is less certain than the present (Chance et al., 2014). Furthermore, although people might have the motivation to eat healthy, keeping this motivation can be difficult, especially when emotions play a role (e.g., stress, tiredness, or hunger) (Chance et al., 2014). Furthermore, in 2019, only 20 percent of the promotions in Dutch grocery stores include healthy products (RTL News, 2019). Unhealthy products are much more promoted because of commercial benefits (RTL News, 2019).
Governments and health institutes try to stimulate healthy food decisions with digital or non-digital solutions. For example, the Dutch Nutrition Centre has introduced an app for getting insights of daily nutrition intakes by keeping a digital food diary (Mijn Voedingscentrum, n.d.). Also, products in grocery stores are sometimes provided with a Nutri-Score label for indicating if a product is healthy or not. The food label has a scale of A-E, whereas A means “healthy” and E “unhealthy”. Egnell et al. (2020) states that this label makes it easier to become aware of how healthy or unhealthy products are. Finally, getting less distracted by unhealthy promotions can be prevented by writing a grocery list (Au et al., 2013).
This research aims to discover how digital tools can be effective for stimulating healthy food decisions. The digital journey is focused on discovering how the Nutri-Score can be used more widely and how the Nutri-Score can be combined with a digital grocery list chatbot with suggestions for healthy products when making an unhealthy decision.
Project
Ideally, I wanted to create a bridge between the Nutri-Score calculator and a chatbot which gives recommendations based on how a product scores on the Nutri-Score scale. In order to evaluate if the Nutri-Score is (indeed) an understandable calculator, and from a more technical perspective, which APIs are available and how the Nutri-Score calculator can be used for a digital solution (like a chatbot), I’ve chosen to separate this project into two parts to discover the possibilities.
Experiment 1: Exploring the Nutri-Score
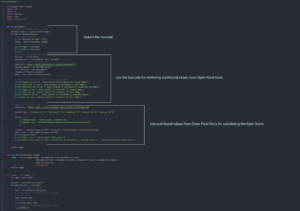
Not all products are attached with a Nutri-Score label. The Nutri-Score calculator can calculate the Nutri-Score based on nutritional values of a product. The Nutri-Score API performs the same as the Nutri-Score calculator. In order to let this API calculator work, nutritional values of a product are needed. When sharing a name or barcode, the API from Open Food Facts provides nutritional values for food products.
Connect detected barcodes to the Open Food Facts API and Nutri-Score
The Python libraries Pyzbar and OpenCV were used for detecting barcodes on products.

Once the barcode was detected, the nutritional values were retrieved via the Open Food Facts API and connected to the Nutri-Score API.

“Real time” experiments
The solution was great when using existing images from my laptop. Unfortunately, the Python code did not run on the mobile application called Pydroid 3.
Pydroid 3 makes it possible to run (most) Python codes on mobile devices. Therefore, I couldn’t do a live user test in a grocery store for non-labelled products. However, I simulated the solution with a prototype in Figma for a few products and requested the users to look out for these products in the grocery store.
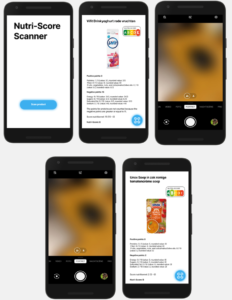
The user uses the prototype to “scan” the barcode of a product and retrieve information. When answering a question about the meaning of the screen, a user first looked at the negative points and answered that the product is not healthy because there were no positive points given (Unox soup). However, when asking the user how healthy the product was based on the Nutri-Score label, the user answered “Oh, this is kind of a healthy product!”.
In order to improve the prototype, the details about the Nutri-Score should be visualized differently. Based on the user test, the prototype was improved as followed.

Users were able to easily find whether a product is healthy or not and they were also surprised about the information. The users did not expect that “Vifit” had a low Nutri-Score and Unox soup scored relatively healthy according to the Nutri-Score.
I didn’t figure out how to implement the Nutri-Score barcode scanner on my laptop, but I was able to give users more options by using a Jupyter notebook setting on a mobile device in order to get real time feedback on products. However, this time they couldn’t use the camera. Instead, they needed to type the names of products. Python’s library BeautifulSoup made it possible to get nutritional values about the first product showed on the Open Food Facts website.
Although not all products could be used due to limitations of the code, users liked to see the values of each product and the relation with the Nutri-Score. The values gave a good explanation why the product scored a certain value. For the future, users would like to see the explanation in a better UI than Jupyter Notebook.
Experiment 2: A chatbot for giving feedback on food decisions
The second part of the project consists of experimenting with a chatbot. I wanted to use a Python-based chatbot, because this seems the most flexible solution for implementing APIs like Nutri-Score and Open Food Facts.
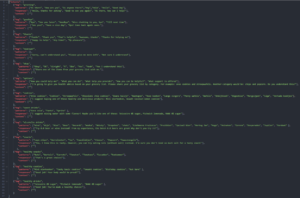
The chatbot uses a JSON file with patterns (what the users says) and responses. The chatbot tries to recognize if the input from the user is related to one of the responses.
Evaluation of the chatbot
After every user test I added more products to the JSON file in order to perform better user tests. However, some products were not included yet. When this happens, the chatbot responses most of the time with “Good job! You’ve made a healthy choice!”. Therefore, the chatbot still shows some limitations.
In general, users responded positive towards the chatbot and could imagine how this can be implemented in an app for making grocery lists. However, transparency was a weak point. It was not clear how the chatbot knew whether a product was healthy or unhealthy.
The combination of product values and Nutri-Score combined with the chatbot response, would be a solution for a better understanding why a product is or is not categorized as healthy. This was somewhat unclear for the users. Furthermore, the suggestions for healthier products were too general (like “fruit”). Lastly, users would like to see suggested products which the user likes, instead of general suggestions.
Conclusion
Python offers useful libraries for stimulating healthy food decisions. Python code alone is, however, not ideal for user tests (in grocery stores), because the code could not work on mobiles. Designing a prototype in Figma was a must. The user tests were helpful for improving the visualization of the Nutri-Score. Users seemed to rely on the Nutri-Score. Therefore, it should be carefully considered if the Nutri-Score is giving accurate information about healthy/unhealthy products. The Figma prototype included only two products, still users understood the purpose of the prototype and were able to use the prototype during user tests. After this experiment, I developed Python code in Jupyter Notebook so that users could fill in products by themselves and retrieve feedback from the Nutri-Score and Open Food Facts APIs. However, it’s unfortunate that the Python code was giving limited responses. Further developments are necessary in the future to develop a user friendly Jupyter Notebook prototype.
Lastly, the chatbot needs further developments in the future. I couldn’t make it work to connect the Nutri-Score and Open Food Facts APIs with the chatbot. The responses given by the chatbot are limited because they are written, as well as the patterns (user input). These patterns can be replaced in the future by Python code for webscraping products from websites (like Albert Heijn). This will prevent the current situation, in which the chatbot guesses to which pattern a product belongs and giving the wrong recommendations; products can be defined as healthy by the chatbot, but this might be not true and it’s likely that users are going to believe this.
I discovered a lot about Python libraries for barcode scanning, chatbots and how to work with multiple APIs. And lastly, the importance of a user-friendly prototype for meaningful user tests and how much people believe the Nutri-Score and chatbot. It was a good starting point for my graduation project, which will be about for stimulating healthy food decisions.
References
Au, N., Marsden, G., Mortimer, D., & Lorgelly, P. K. (2013). The cost-effectiveness of shopping to a predetermined grocery list to reduce overweight and obesity. Nutrition & Diabetes, 3(6), e77. https://doi.org/10.1038/nutd.2013.18
Chance, Z., Gorlin, M., & Dhar, R. (2014). Why Choosing Healthy Foods is Hard, and How to Help: Presenting the 4Ps Framework for Behavior Change. Customer Needs and Solutions, 1(4), 253–262. https://doi.org/10.1007/s40547-014-0025-9
Egnell, M., Talati, Z., Galan, P., Andreeva, V. A., Vandevijvere, S., Gombaud, M., Dréano-Trécant, L., Hercberg, S., Pettigrew, S., & Julia, C. (2020). Objective understanding of the Nutri-score front-of-pack label by European consumers and its effect on food choices: an online experimental study. International Journal of Behavioral Nutrition and Physical Activity, 17(1). https://doi.org/10.1186/s12966-020-01053-z
National Institute of Diabetes and Digestive and Kidney Diseases. (2021, September 8). Health Risks of Overweight & Obesity. https://www.niddk.nih.gov/health-information/weight-management/adult-overweight-obesity/health-risks
Mijn Voedingscentrum. (n.d.). Mijn Voedingscentrum. Retrieved 24 October 2021, from https://mijn.voedingscentrum.nl/nl/eetmeter/
RIVM. (n.d.). Overweight | Numbers & Context | Trends |Public health care. Retrieved 8 September 2021, from https://www.volksgezondheidenzorg.info/onderwerp/overgewicht/cijfers-context/trends#node-trend-overgewicht-volwassenen
RTL News. (2019, June 24). Grocery stores promote mostly unhealthy food. RTL News. https://www.rtlnieuws.nl/economie/bedrijven/artikel/4756366/supermarkten-ongezonde-voeding-aanbieding-promotie